
When do giant hogweed plants emerge in Scotland?
Summary
Giant hogweed is an invasive non-native plant that is widely spread across Scotland. The Scottish Invasive Species Initiative has been managing and controlling this plant across the north of Scotland since 2018. Whilst methods of control for giant hogweed are generally known there is little information and data detailing the timing of giant hogweed seedling emergence in Scotland. This information would be helpful in ensuring that control work is delivered at the optimal time of year to make management most effective and impactful.
To address this knowledge gap the Scottish Invasive Species Initiative, with the help of volunteers, ran a seedling emergence study from March to October 2021. Data was gathered on giant hogweed seedling emergence across 10 different river catchments in the north-east of Scotland. Participants marked out 1m2 plots and recorded the number of seedlings emerging in these plots per month. In total, 13 people participated in the study monitoring 49 plots across 14 sites. Seedling emergence was high in March, peaked in April and May, then steadily declined until October.
Results from this study will help to inform seasonal management plans for giant hogweed control, including our sheep grazing trial near Macduff at the bottom of the River Deveron catchment.
1. Background
The Scottish Invasive Species Initiative, in partnership with the University of Aberdeen, has been running a trial since 2019 to investigate the feasibility of controlling giant hogweed through sheep grazing. Two factors which are critical to the establishment of a successful grazing regime are:
- the time of year sheep are introduced to a site, and
- the length of time they remain on the site.
However, the grazing pressure deployed to the giant hogweed must correlate with the timing of giant hogweed emergence to be most successful.
There are few records detailing the timing of giant hogweed seedling emergence in general or specifically in Scotland. Although it is known that seedlings emerge and grow in the spring, there is little information on the length of the seedling emergence period or when or if there are peaks of emergence within the overall period. Gathering information on seasonal seedling emergence would allow us to identify the best time of year for sheep to be introduced to and removed from giant hogweed infested sites.
This study investigated the timing of seedling emergence over the anticipated growing period (March-October). Results from this study will help to inform the preparation of guidance for land managers who are interested in implementing sheep grazing as a control method for giant hogweed.
|
2. IntroductionGiant hogweed is a non-native invasive species, introduced to Britain in the 19th century. The plant poses a human health hazard as the sap is phytotoxic, causing serious skin burns under sunlight. It spreads by seed dispersal and is commonly found along rivers as seeds are dispersed by the water. The Scottish Invasive Species Initiative controls giant hogweed across its project area in the north of Scotland having identified it as a key target species within the project. It can be controlled by herbicide application and manual cutting of flower heads. Treatment normally takes place between March and July. There is currently little or no information available on giant hogweed seedling emergence in Scotland other than the general assumption that this takes place from spring and continues through the summer growing season. From anecdotal evidence it appears that emergence periods can vary between and across river catchments and geographical areas. Further understanding of the timing of seedling emergence would allow us to identify and refine the best time of year for control work to take place – whatever the method of control being deployed. Therefore, the aim of this study was to investigate the timing of seedling emergence across north-east Scotland. |
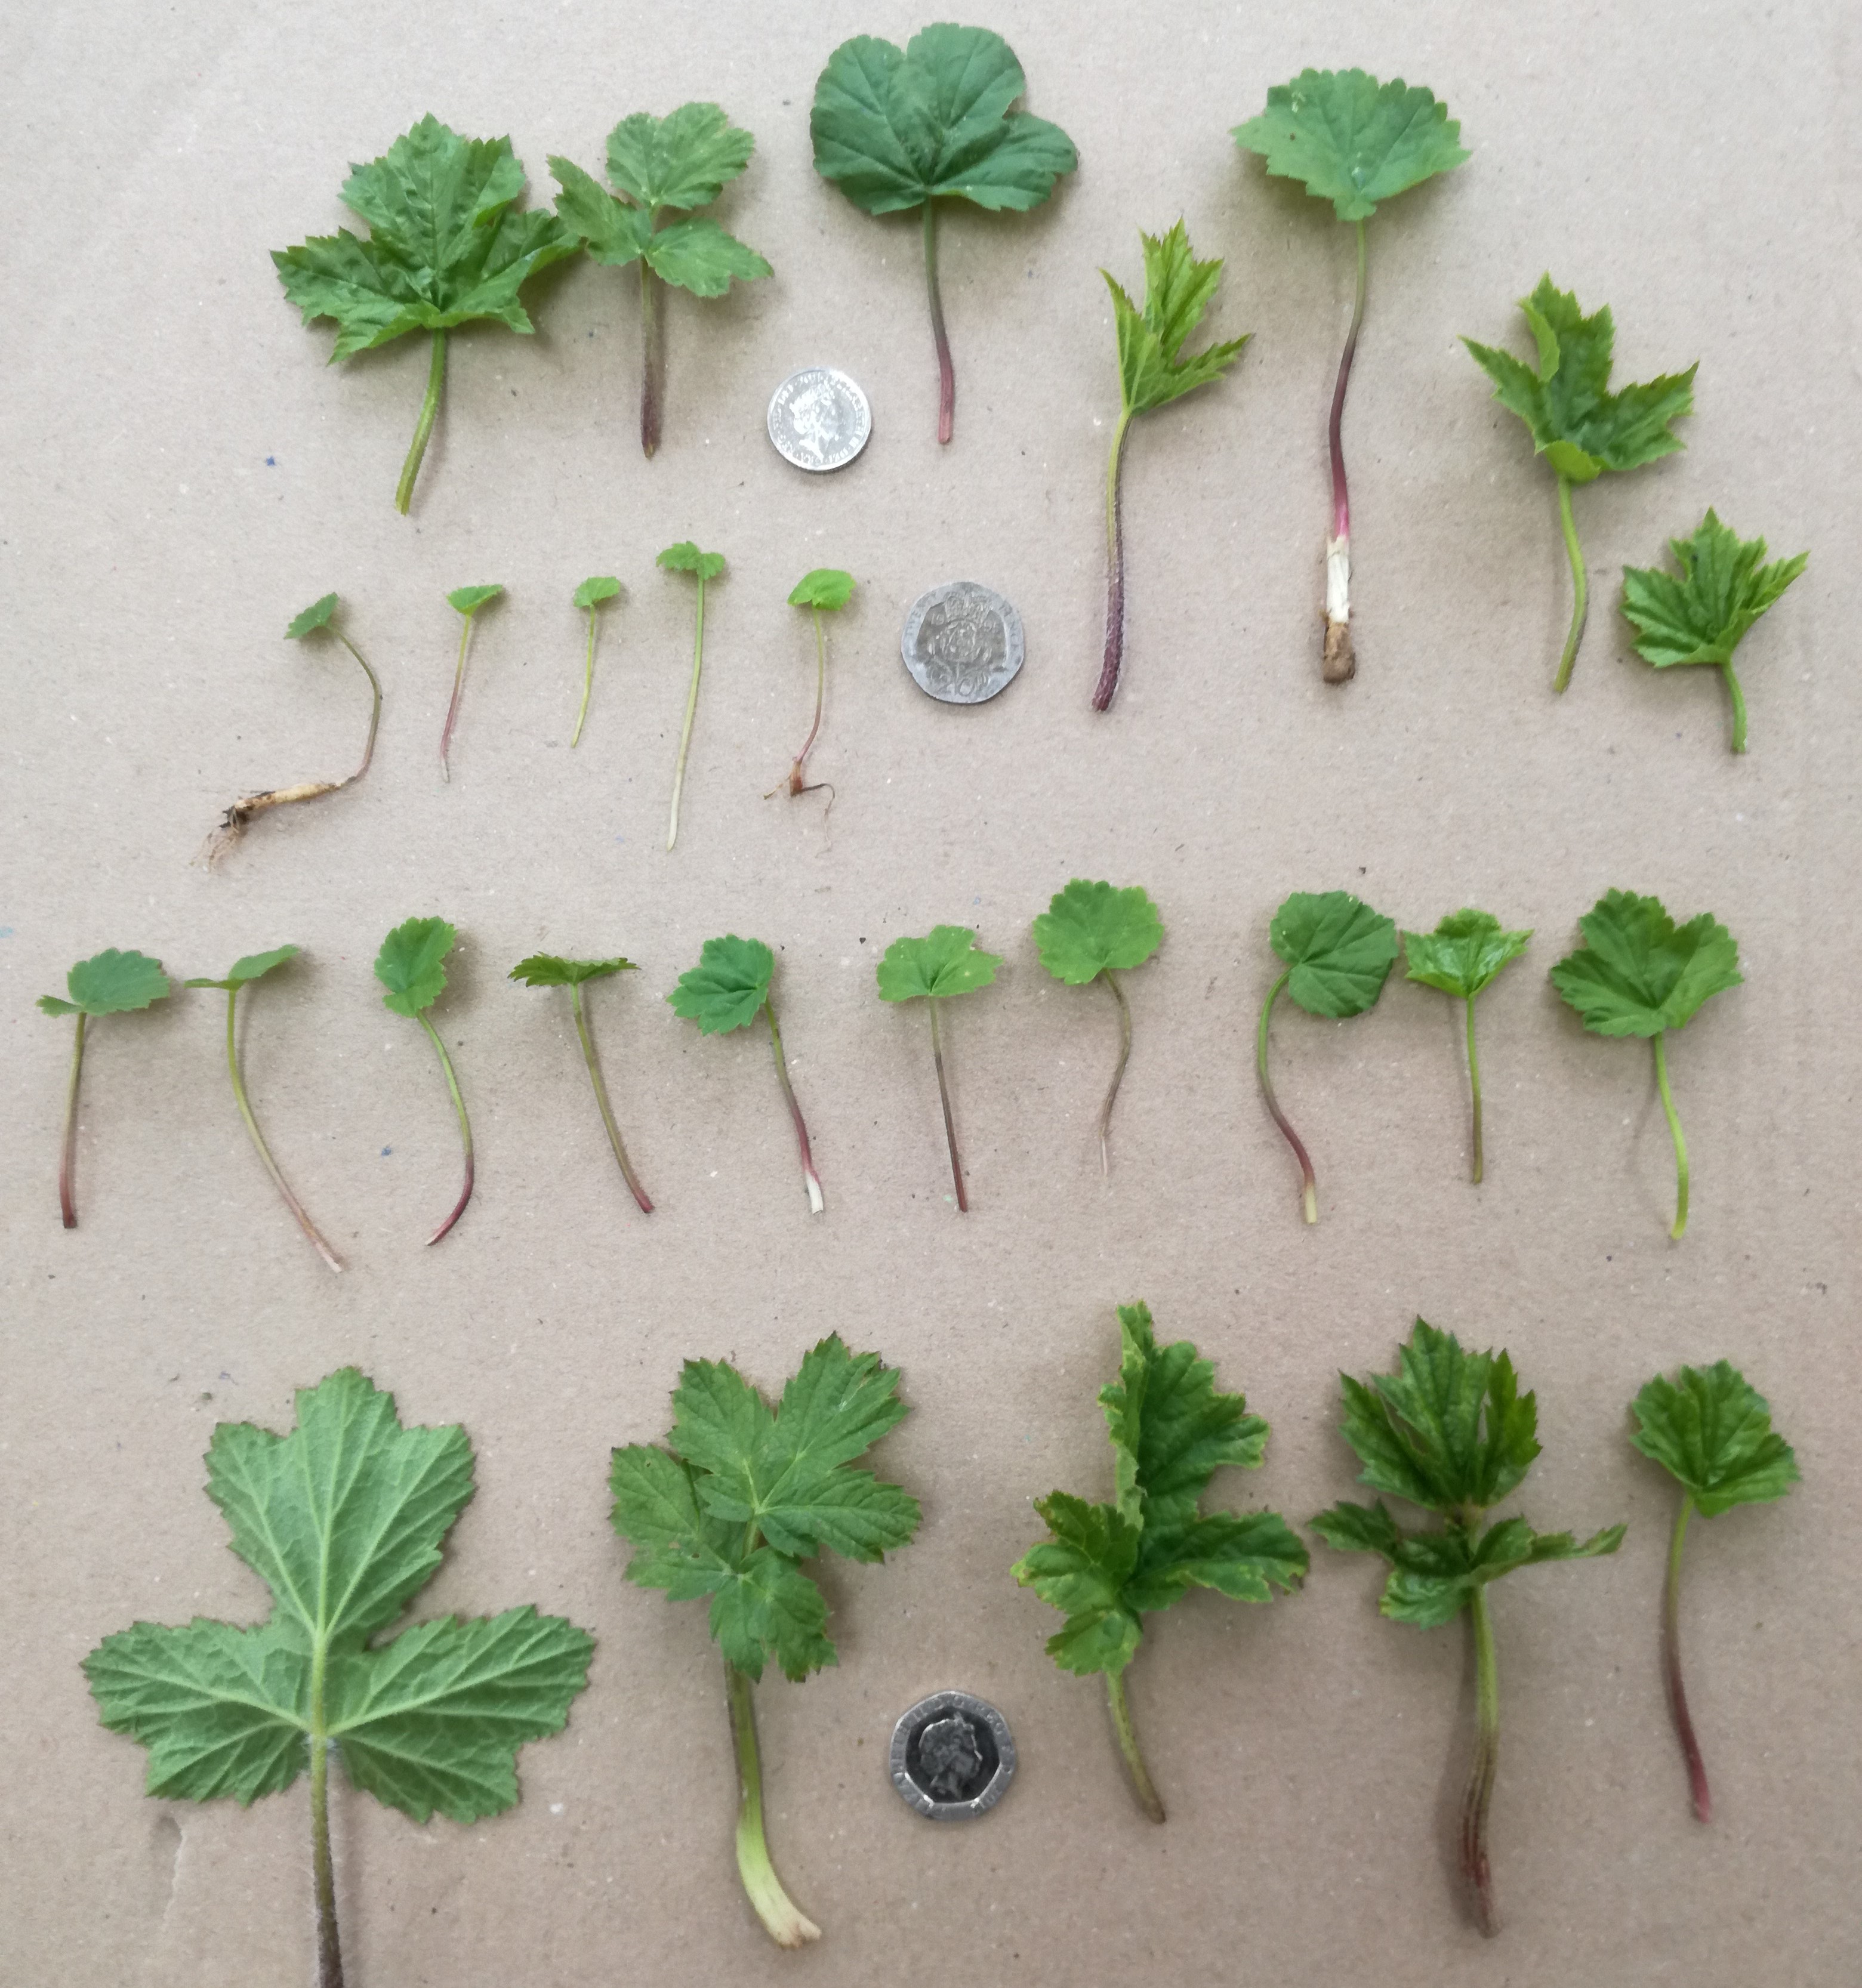 |
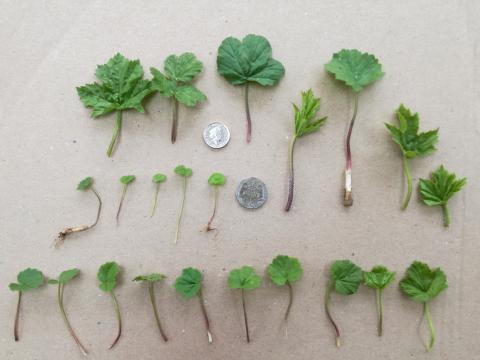
| Figure 1: Range of giant hogweed seedling leaf forms |
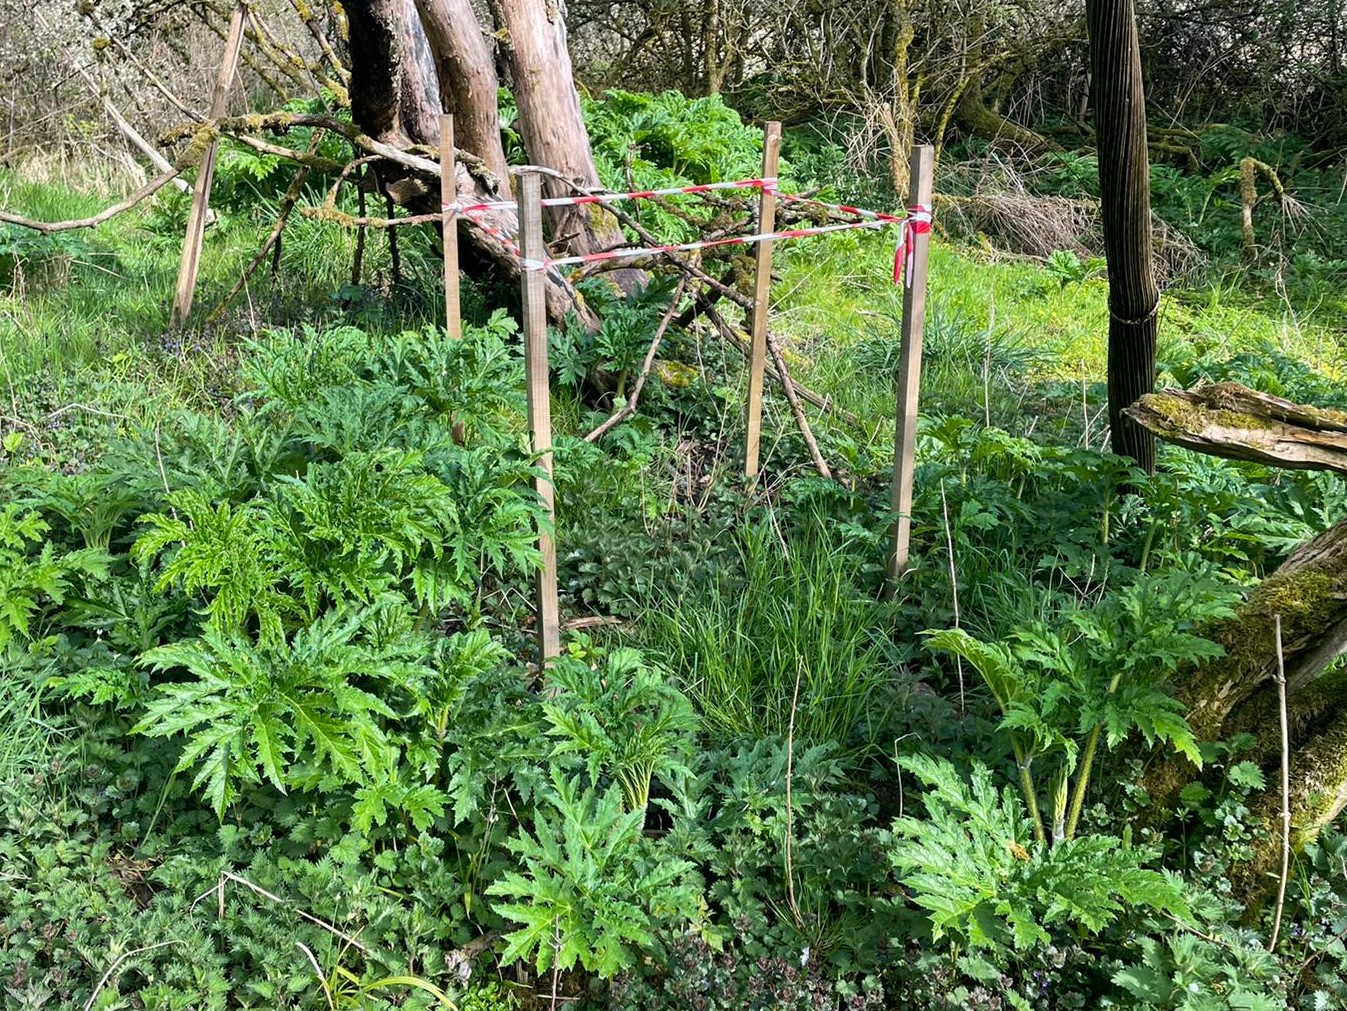
3. MethodsThe study ran for the duration of the 2021 growing season (March to October) at 14 sites across the project area. The aim was to include sites from a range of different river catchments and site conditions across the project area. This would seek to capture variation in emergence times between different areas and catchments. Scottish Invasive Species Initiative staff, volunteers and Fishery Trust staff participated in the study. A total of 13 participants took part from March until October 2021, monitoring 14 separate sites (see Map 1) with a total of 49 individual 1m2 plots. The range of participant locations allowed us to include a range of locations and river catchments within the project area. Sites were selected in locations where giant hogweed was known to grow and 1m2 plots were marked out at each site. Depending on site location, multiple plots could be formed within each site. These plots were permanently in place for the duration of the study and participants were advised not to apply herbicide to their plots throughout the season. Data recording sheets and a detailed methodology was provided to participants to ensure work was completed consistently and safely. Grid references for individual plots, altitude of the site, overall number of plots and a brief site description were recorded at each location. |
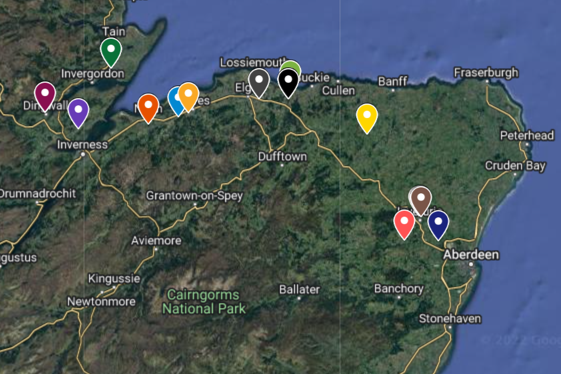 Map 1: Locations of the 14 seedling emergence trial sites across north-east Scotland |
Data collection1. Participants were asked to visit their plots in the first week of each month from March to October. At each visit and for each plot the following were recorded:
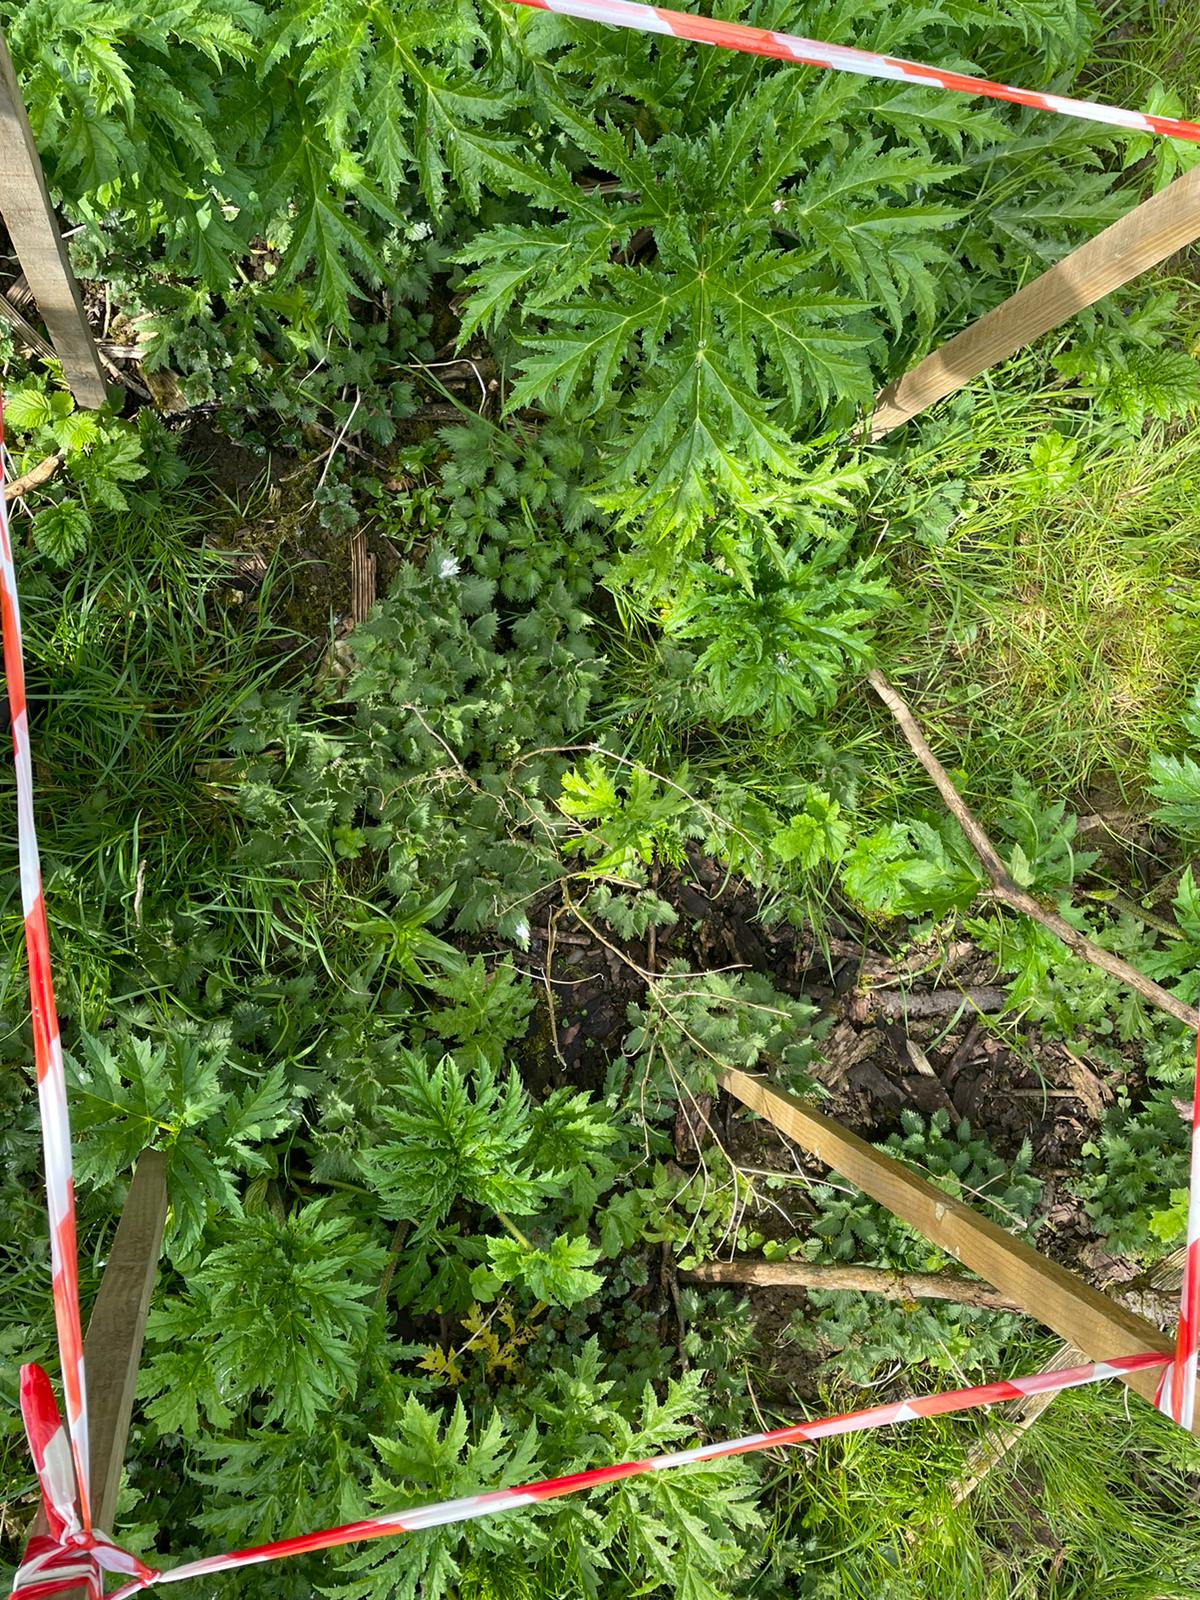
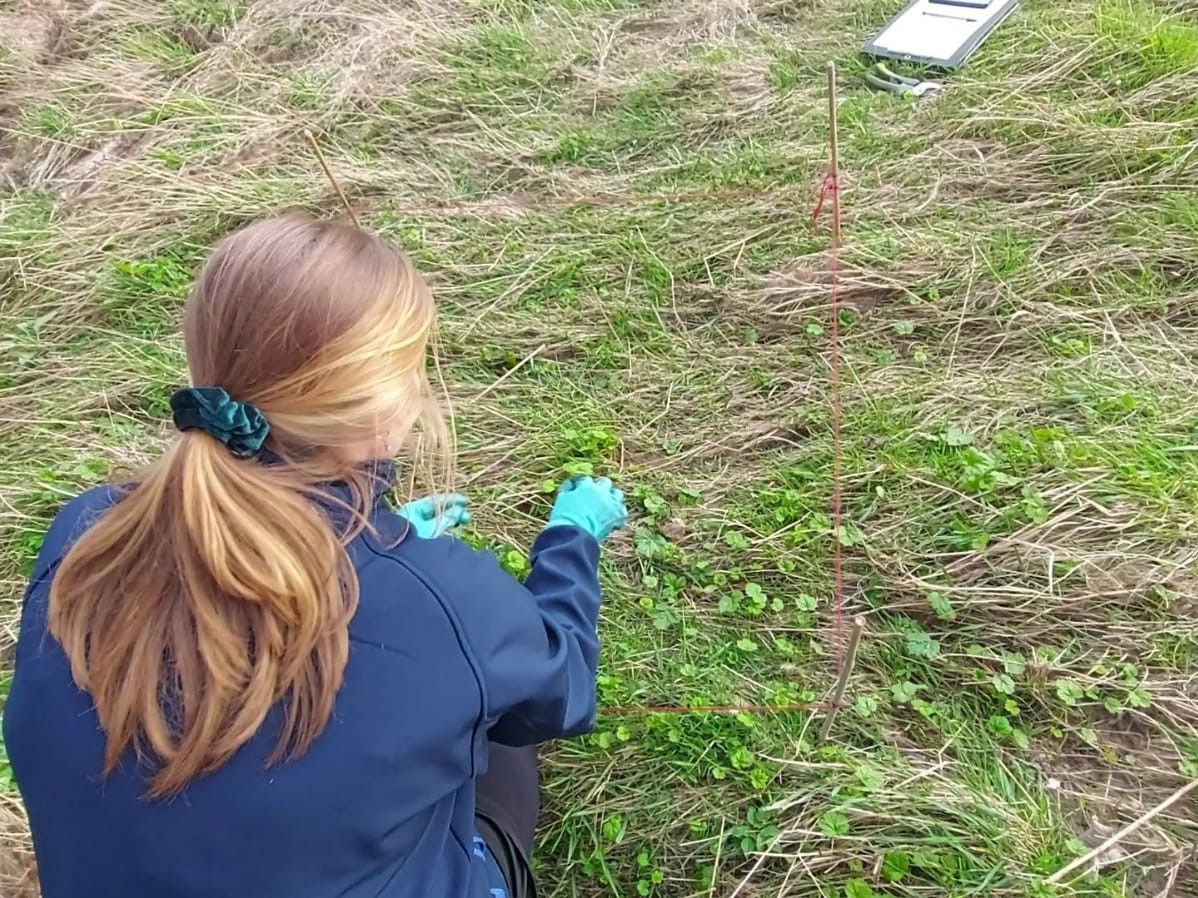
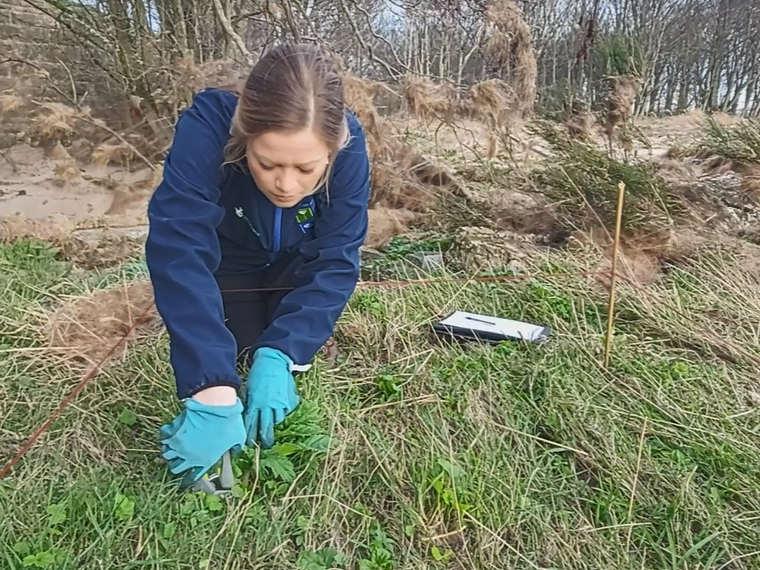
2. Participants were also asked to take a close-up photograph of each plot from above and a wide-angle photograph showing the surroundings and general site aspect (see example images in Figure 3). This provided a visual record of conditions surrounding each plot during the study. 3. Participants were then asked to ‘simulate grazing’ in the plot (see Figure 4 below) at each monthly visit. Larger plants were cut back to ground level and seedlings removed. The following was recorded:
|
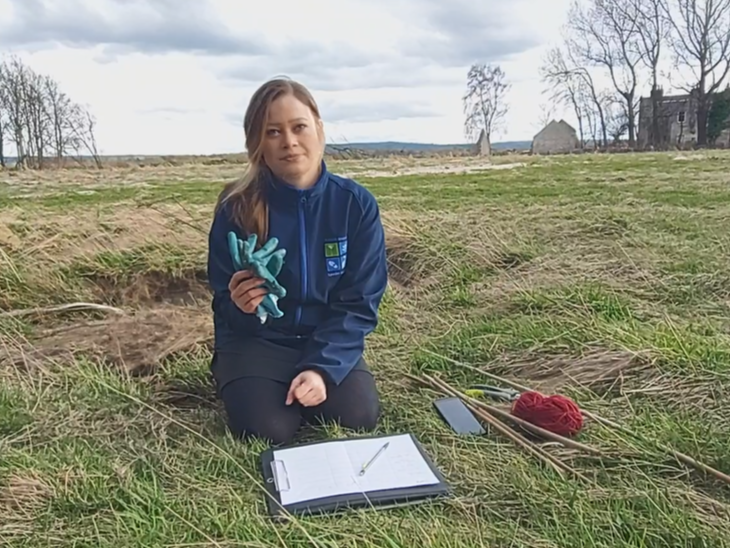 |
| 4. Recorded observations from monthly visits were sent to Scottish Invasive Species Initiative staff for processing. | Figure 2: Project Officer Karen Muller with equipment, including: bamboo canes and string to mark out plots, recording sheet, protective gloves and secateurs. |
 |
 |
|
| Figure 3: Wide angle and close up photos of a 1m2 plot marked out with wooden stakes and tape |
||
 |
 |
|
|
Figure 4: Participants were asked to pull out seedlings (left image) and cut back larger plants (right) to ground level |
||
4. Results
The study sites were spread across 10 different river catchments and incorporated a variety of altitudes and habitat types (see Table 1 below). Canopy cover was recorded at each site visit and varied seasonally and across plots - both within and between sites - from open to partial shade to full shade.
| Site Name | General Site Grid Reference | Number of Plots | Altitude (m) | Habitat | |
| River Nairn | NH8804254707 | 3 | 10 | Riparian woodland | |
| River Ury | NJ7735822955 | 5 | 50 | Riparian grassland | |
| Kilmuir Bay, Cromarty Firth | NH7661873280 | 5 | 11 | Estuary woodland/grassland | |
| River Findhorn | NJ0120857966 | 3 | 16 | Riparian woodland | |
| Munlochy, Munlochy Bay | NH6504453668 | 3 | 33 | Woodland | |
| Muckle Burn, River Findhorn | NH9805656782 | 3 | 30 | Riparian woodland/grassland | |
| Black Burn, River Don | NJ8333514774 | 3 | 56 | Woodland/grassland | |
| Kemnay, River Don | NJ7205015231 | 3 | 76 | River island | |
| Unnamed burn, River Lossie | NJ2476662193 | 4 | 16 | Riparian woodland | |
| River Peffrey | NH5427159596 | 5 | 2 | Riparian woodland | |
| Spey Bay, River Spey | NJ3484864466 | 3 | 0 | Riparian floodplain woodland | |
| Black Burn, River Spey site 1 | NJ3423261945 | 3 | 20 | Riparian woodland | |
| Black burn, River Spey site 2 | NJ3416562058 | 3 | 20 | Riparian woodland | |
| River Deveron | NJ5998449980 | 3 | 68 | Woodland |
Not all participants were able to visit all plots every month. Table 2 (below) shows the number of plots that were visited per month. From March to September, 43 to 49 plots were visited each month (out of 49 total). However, in October only 34 plots were visited – weather conditions were more challenging at this time of year and some plots could not be visited due to site conditions or volunteer availability.
Table 2: The number of plots visited per month. There were 49 plots in total across 14 study sites.
| Number of plots visited per month | ||||||||
| March | April | May | June | July | August | September | October | |
| Total | 44 | 48 | 49 | 44 | 45 | 45 | 43 | 34 |
The total number of seedlings removed per month across all sites is shown in Figure 5 (below). This figure shows the ‘seedling emergence curve’, illustrating the pattern of seedling emergence across the growing season.
| Figure 5 shows that seedling emergence was already high in March when the study commenced with a total of 1135 seedlings removed from the plots. This indicates that the growing season for giant hogweed seedlings started in February (or perhaps in some locations in January) across the study area. Seedling emergence increased to a total of 2159 in April, peaked at 2451 in May and then steadily declined in June and July. By August emergence is low with only 205 seedlings removed. By October, only 61 seedlings were removed across the visited plots (34). | 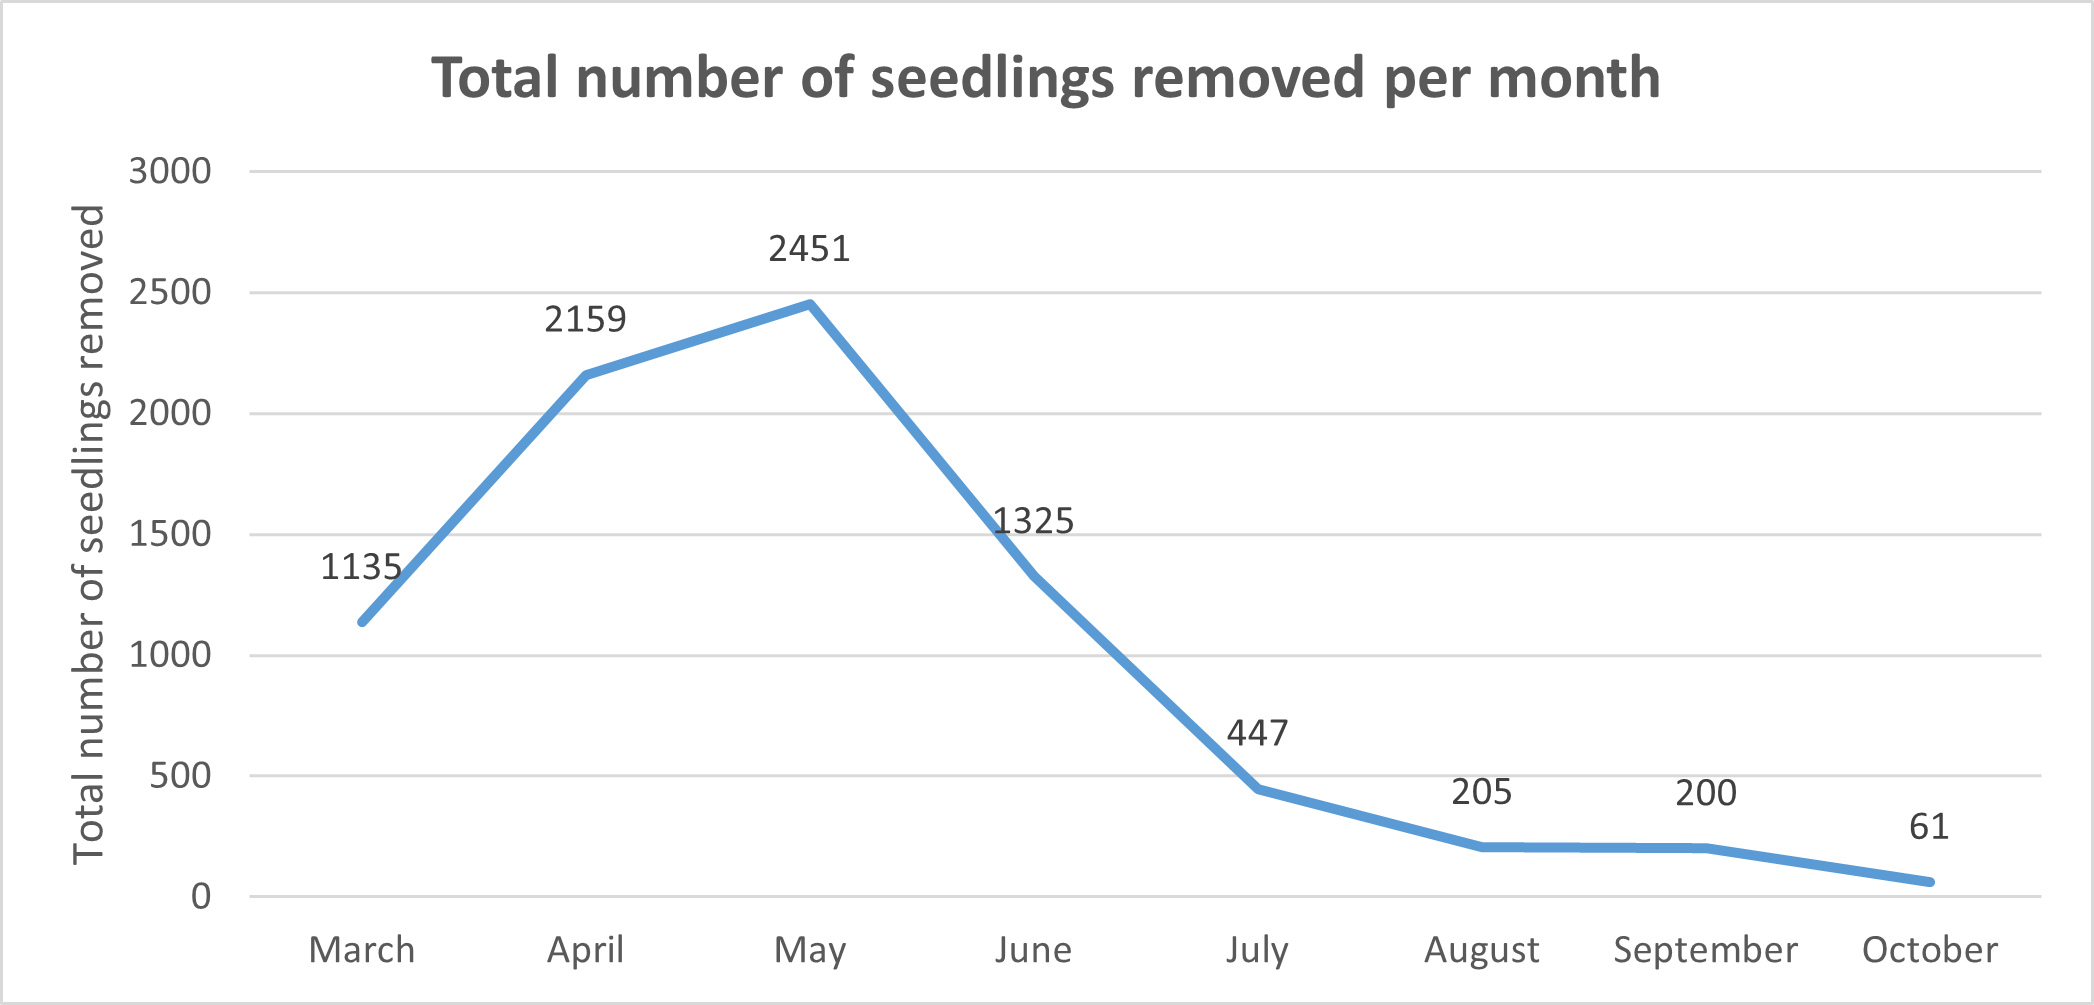 |
| Figure 5: Total number of seedlings removed per month from all 49 1m2 plots |
| The ‘seedling emergence curve’ can also be seen in Figure 6, which plots the average number of seedlings removed per month from the plots. At the start of the study, in March, an average of 26 giant hogweed seedlings were removed from each plot. This increased to an average of 45 in April and peaked at 50 in May before steadily declining over the summer. In August and September, only 5 seedlings were removed from each plot on average and in October the average dropped to 2 seedlings removed per visited plot. | 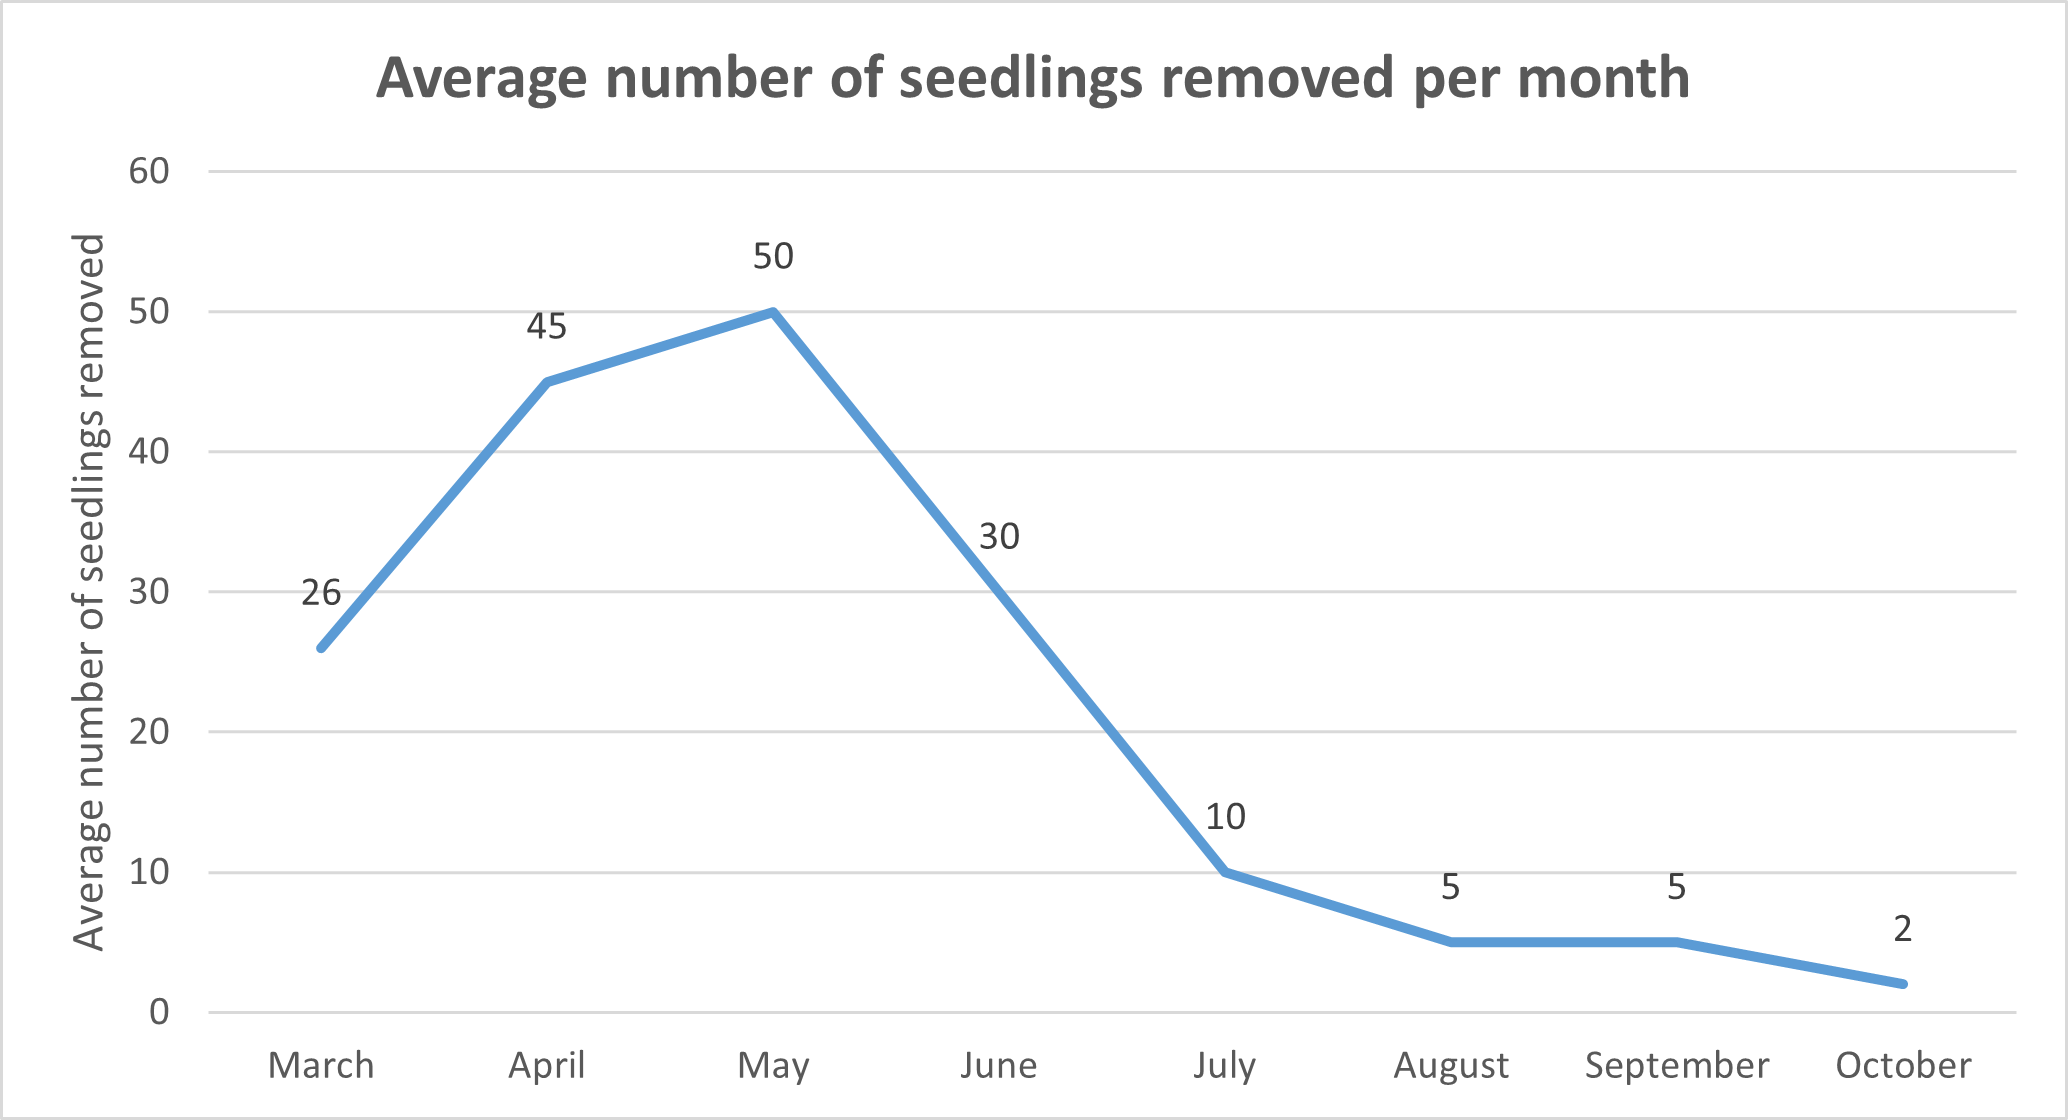 |
| Figure 6: Average number of seedlings removed per month from the 1m2 plots |
We recognise that variation in the number of plots visited per month could influence the seedling emergence curve in Figure 5, which is prepared using the total number of seedlings removed across all plots by month. Therefore, we have included the average number of seedlings removed per plot per month in Figure 6, to account for this variation. Regardless, both figures show the same clear pattern of seedling emergence over the study period.
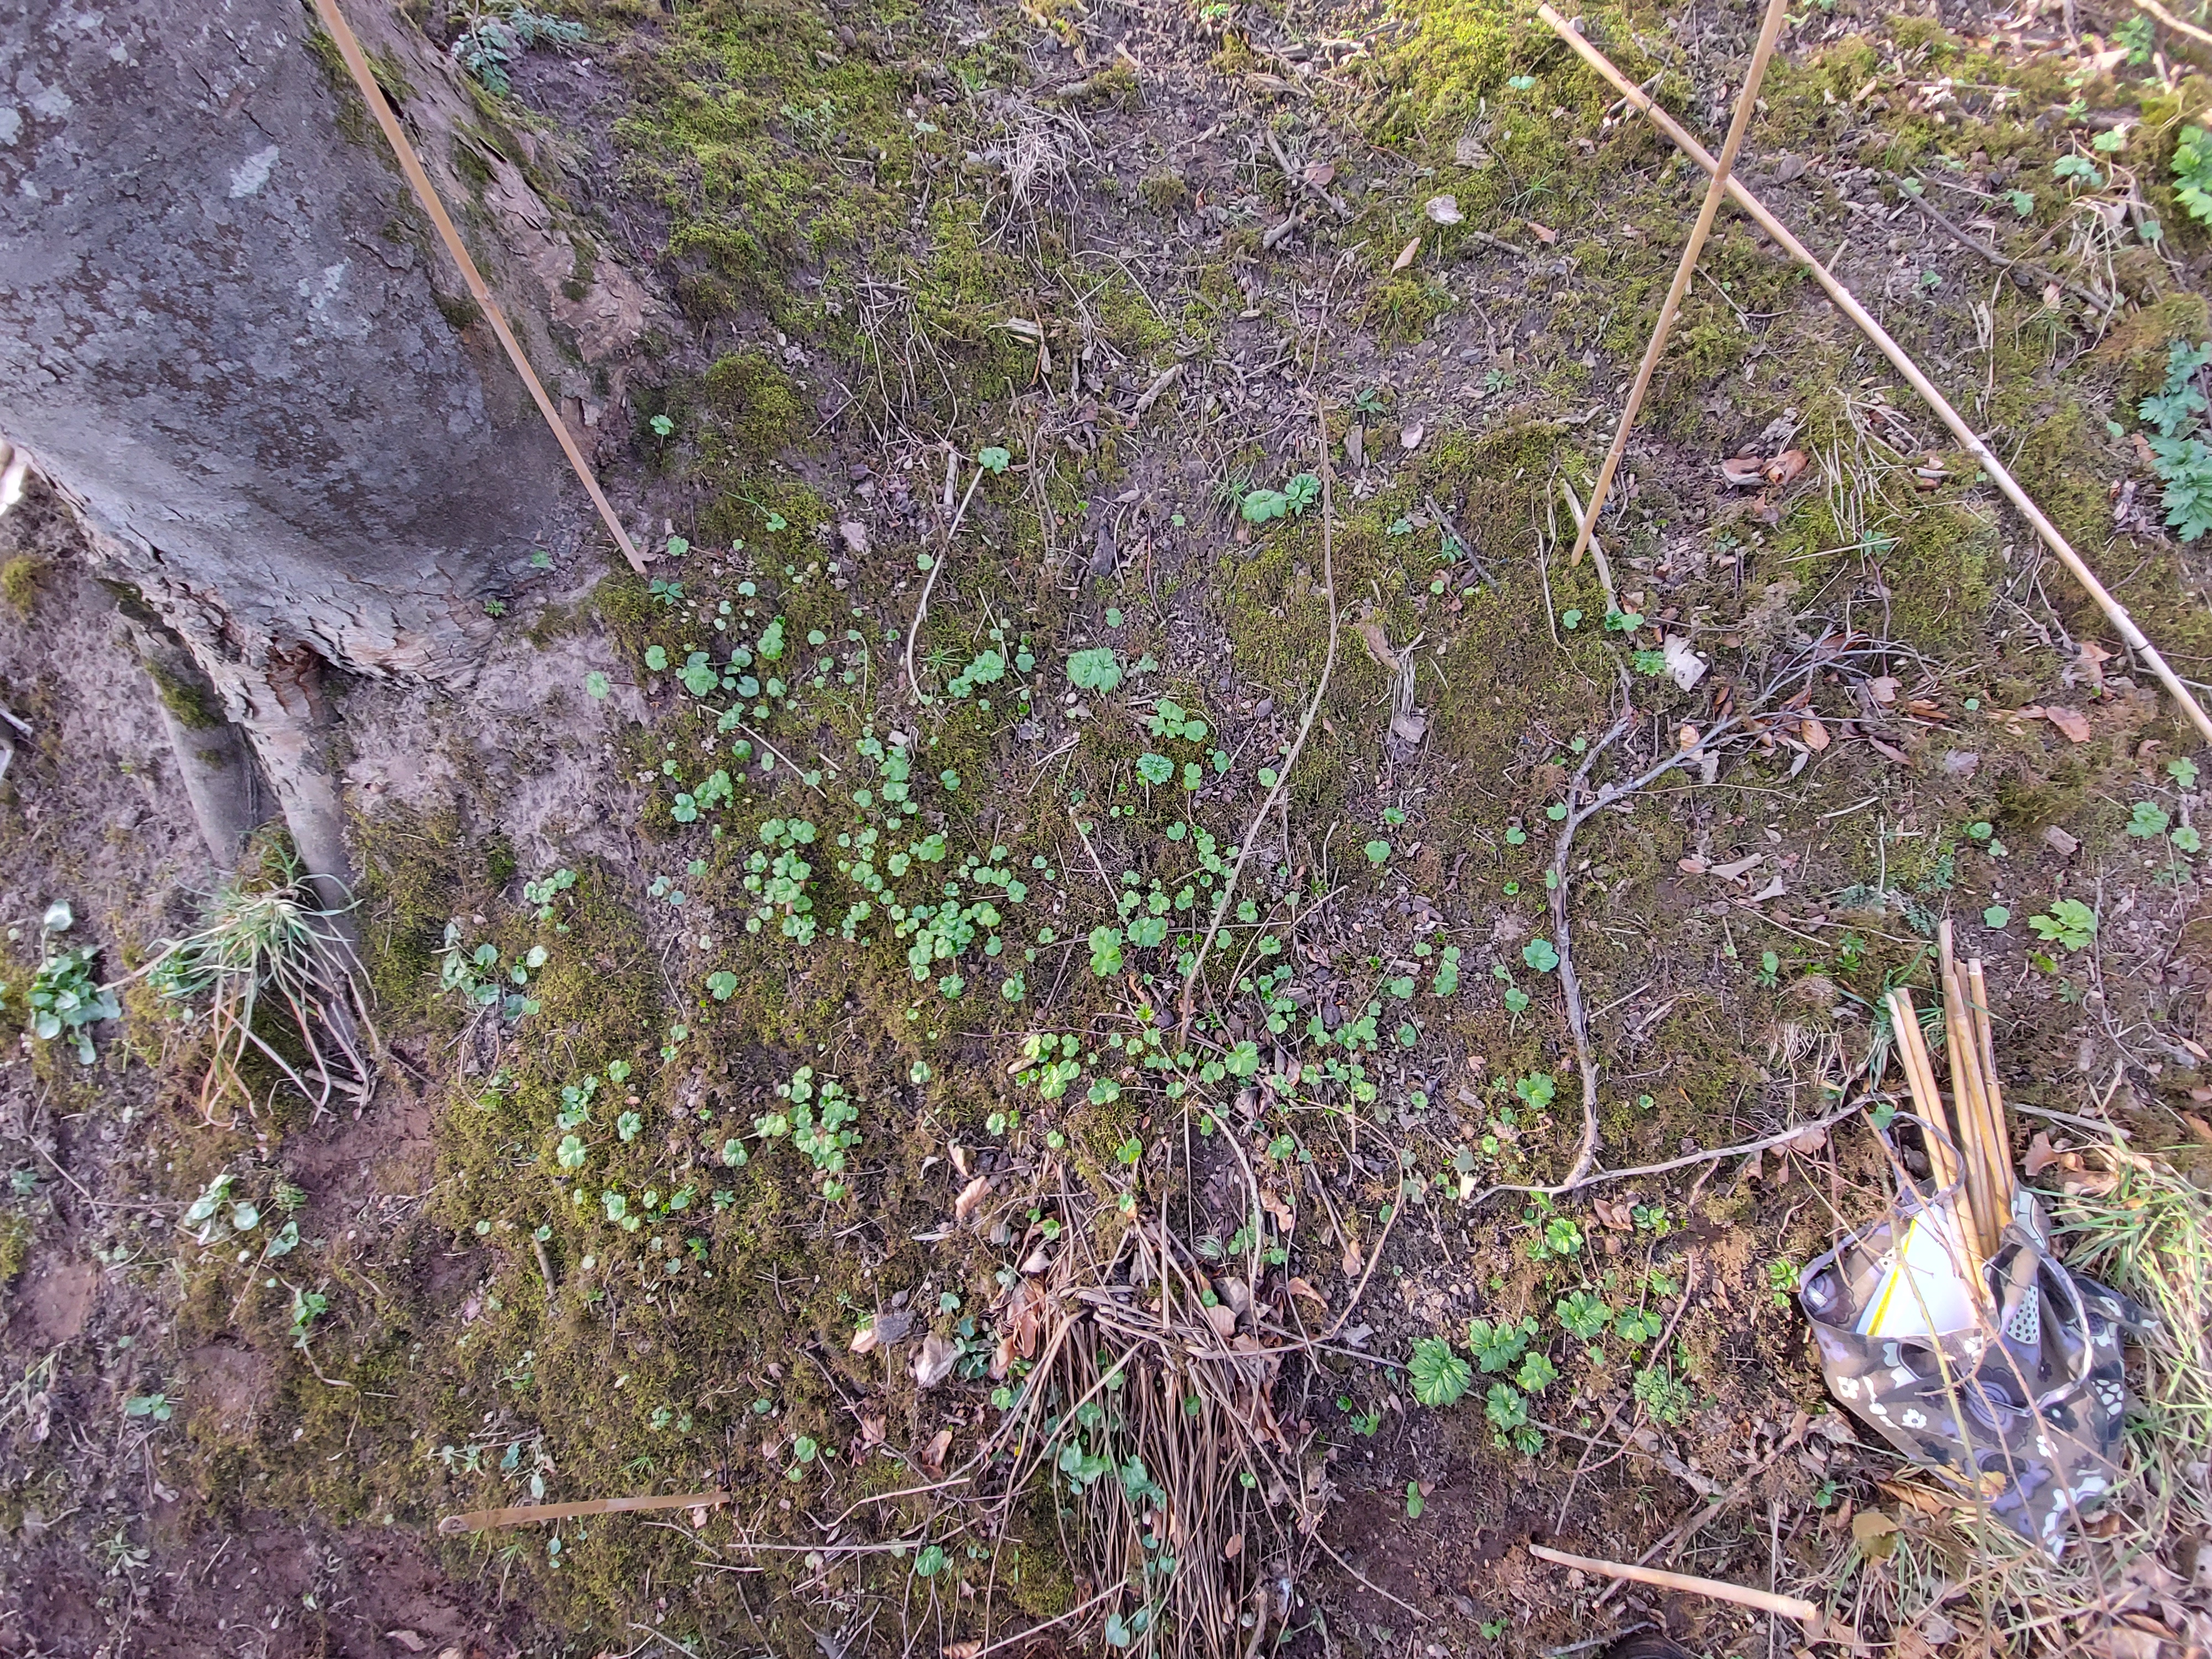
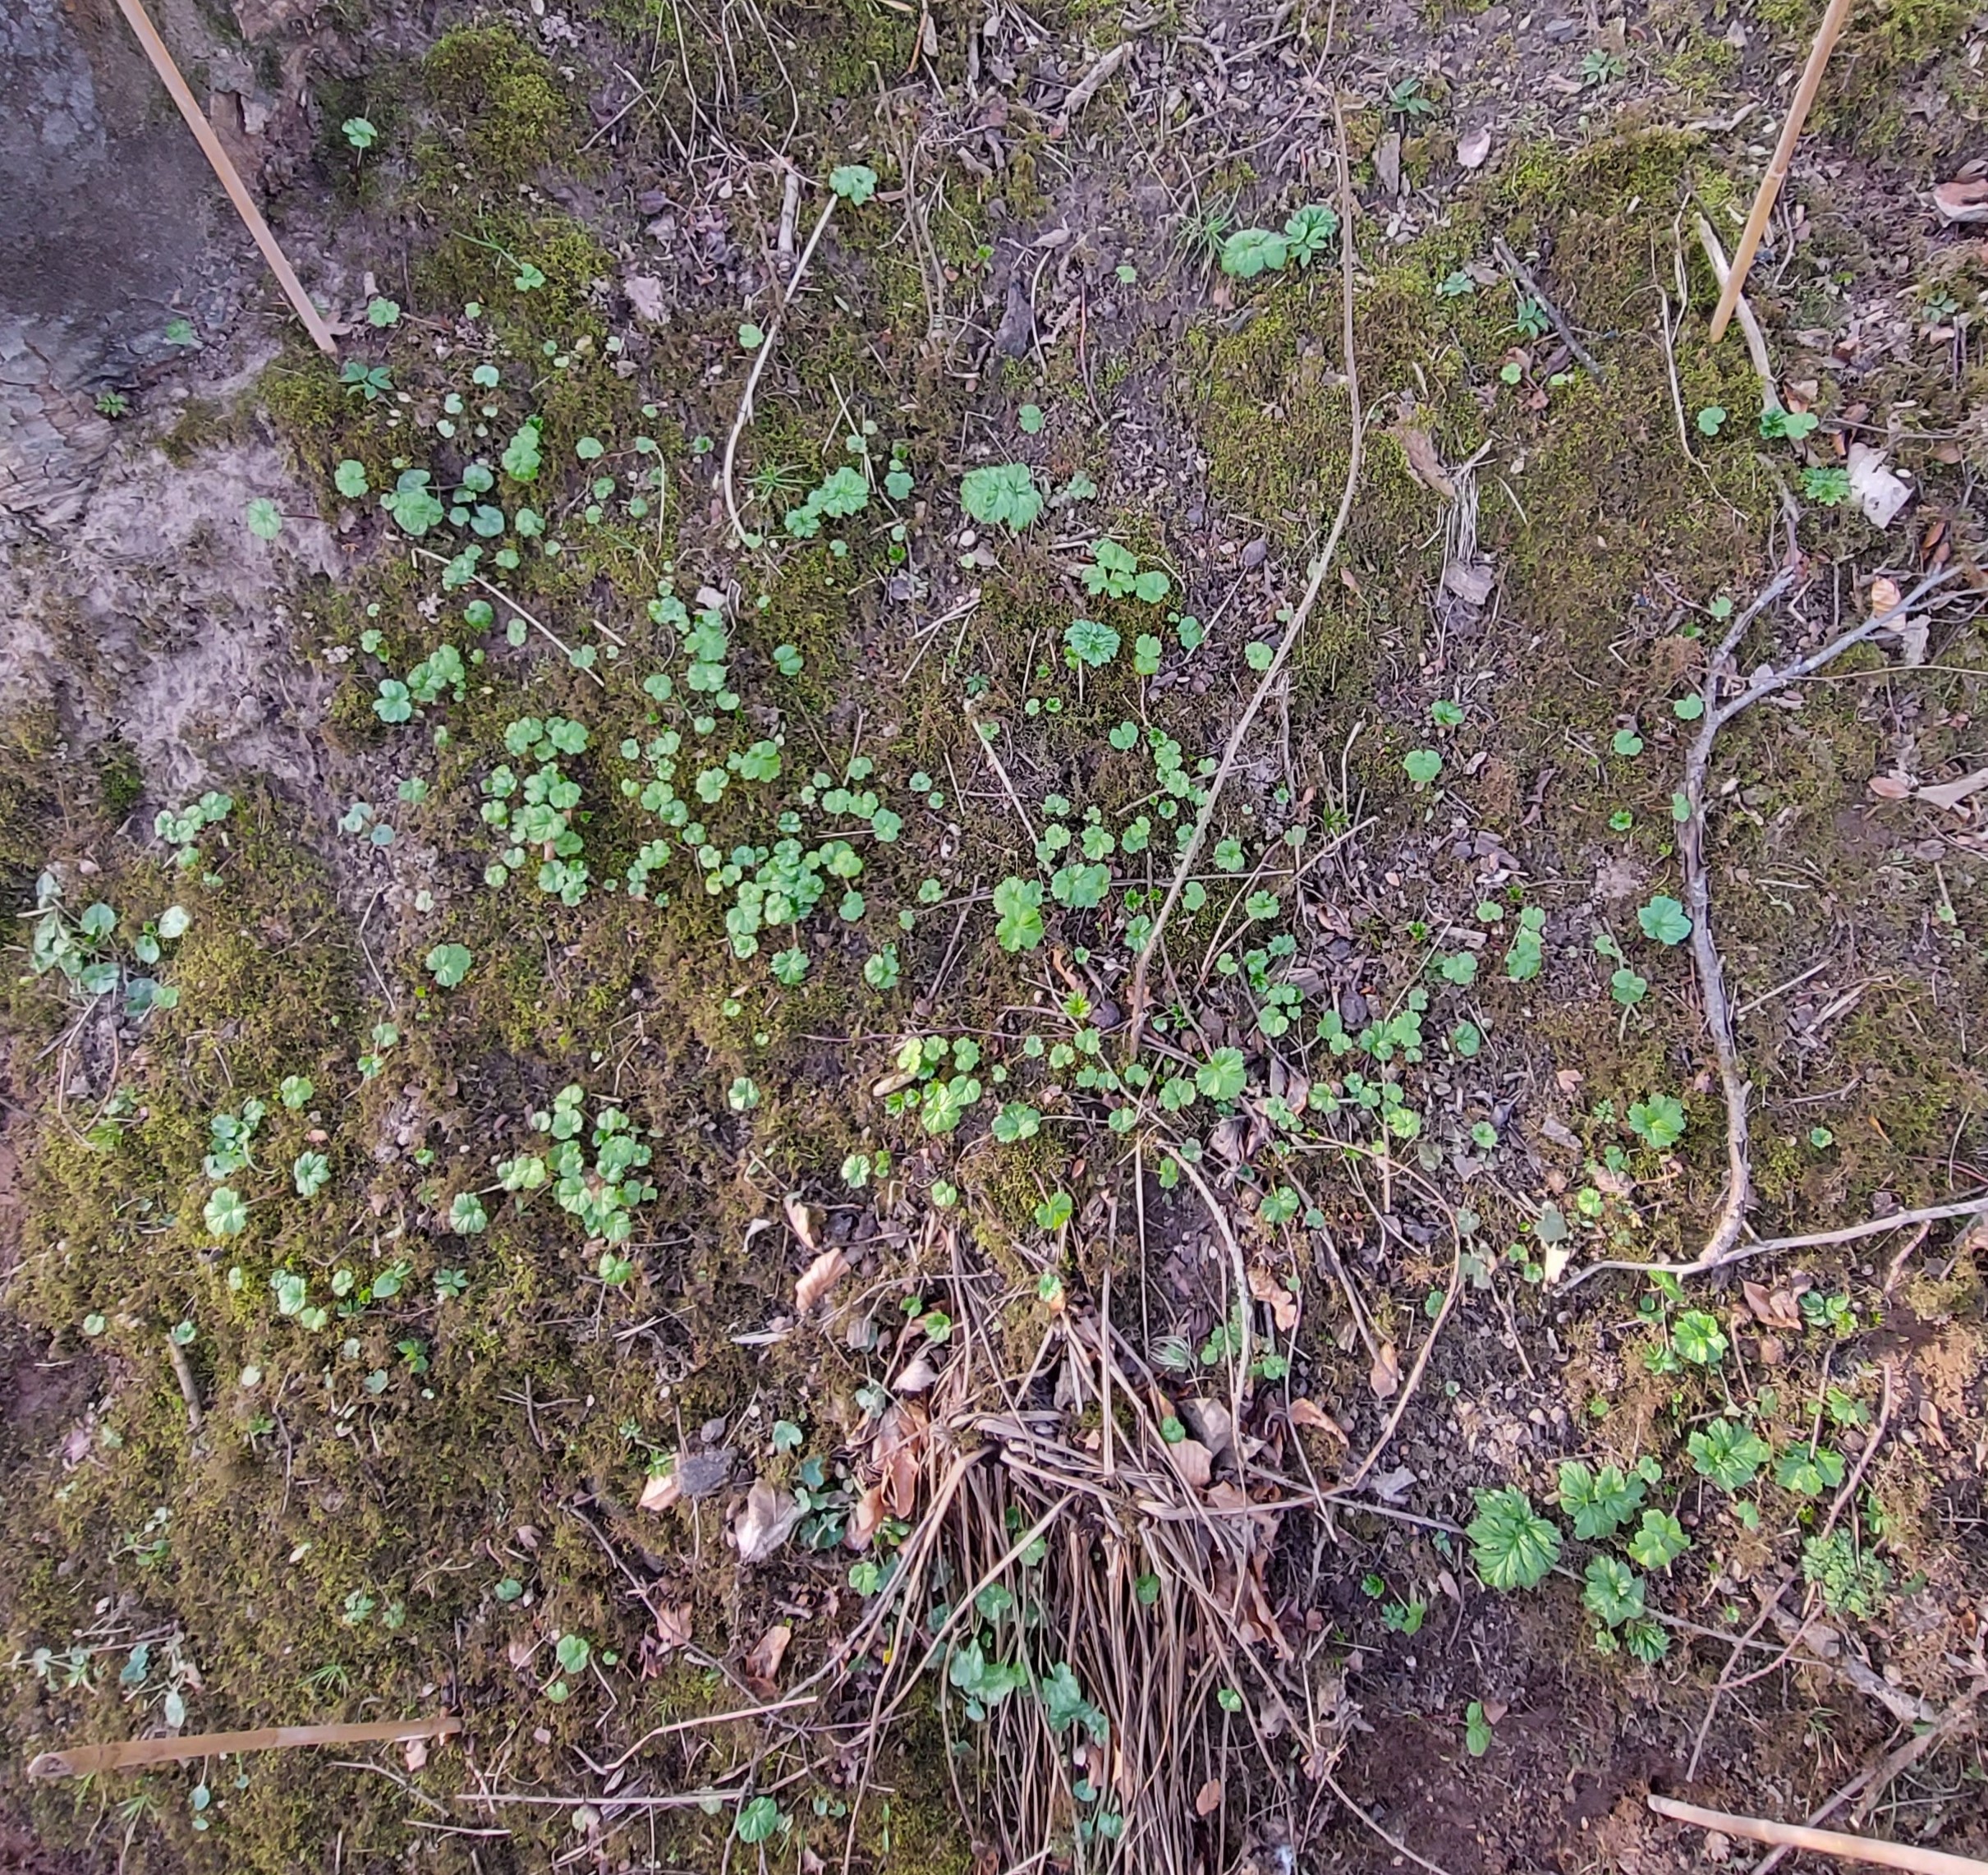
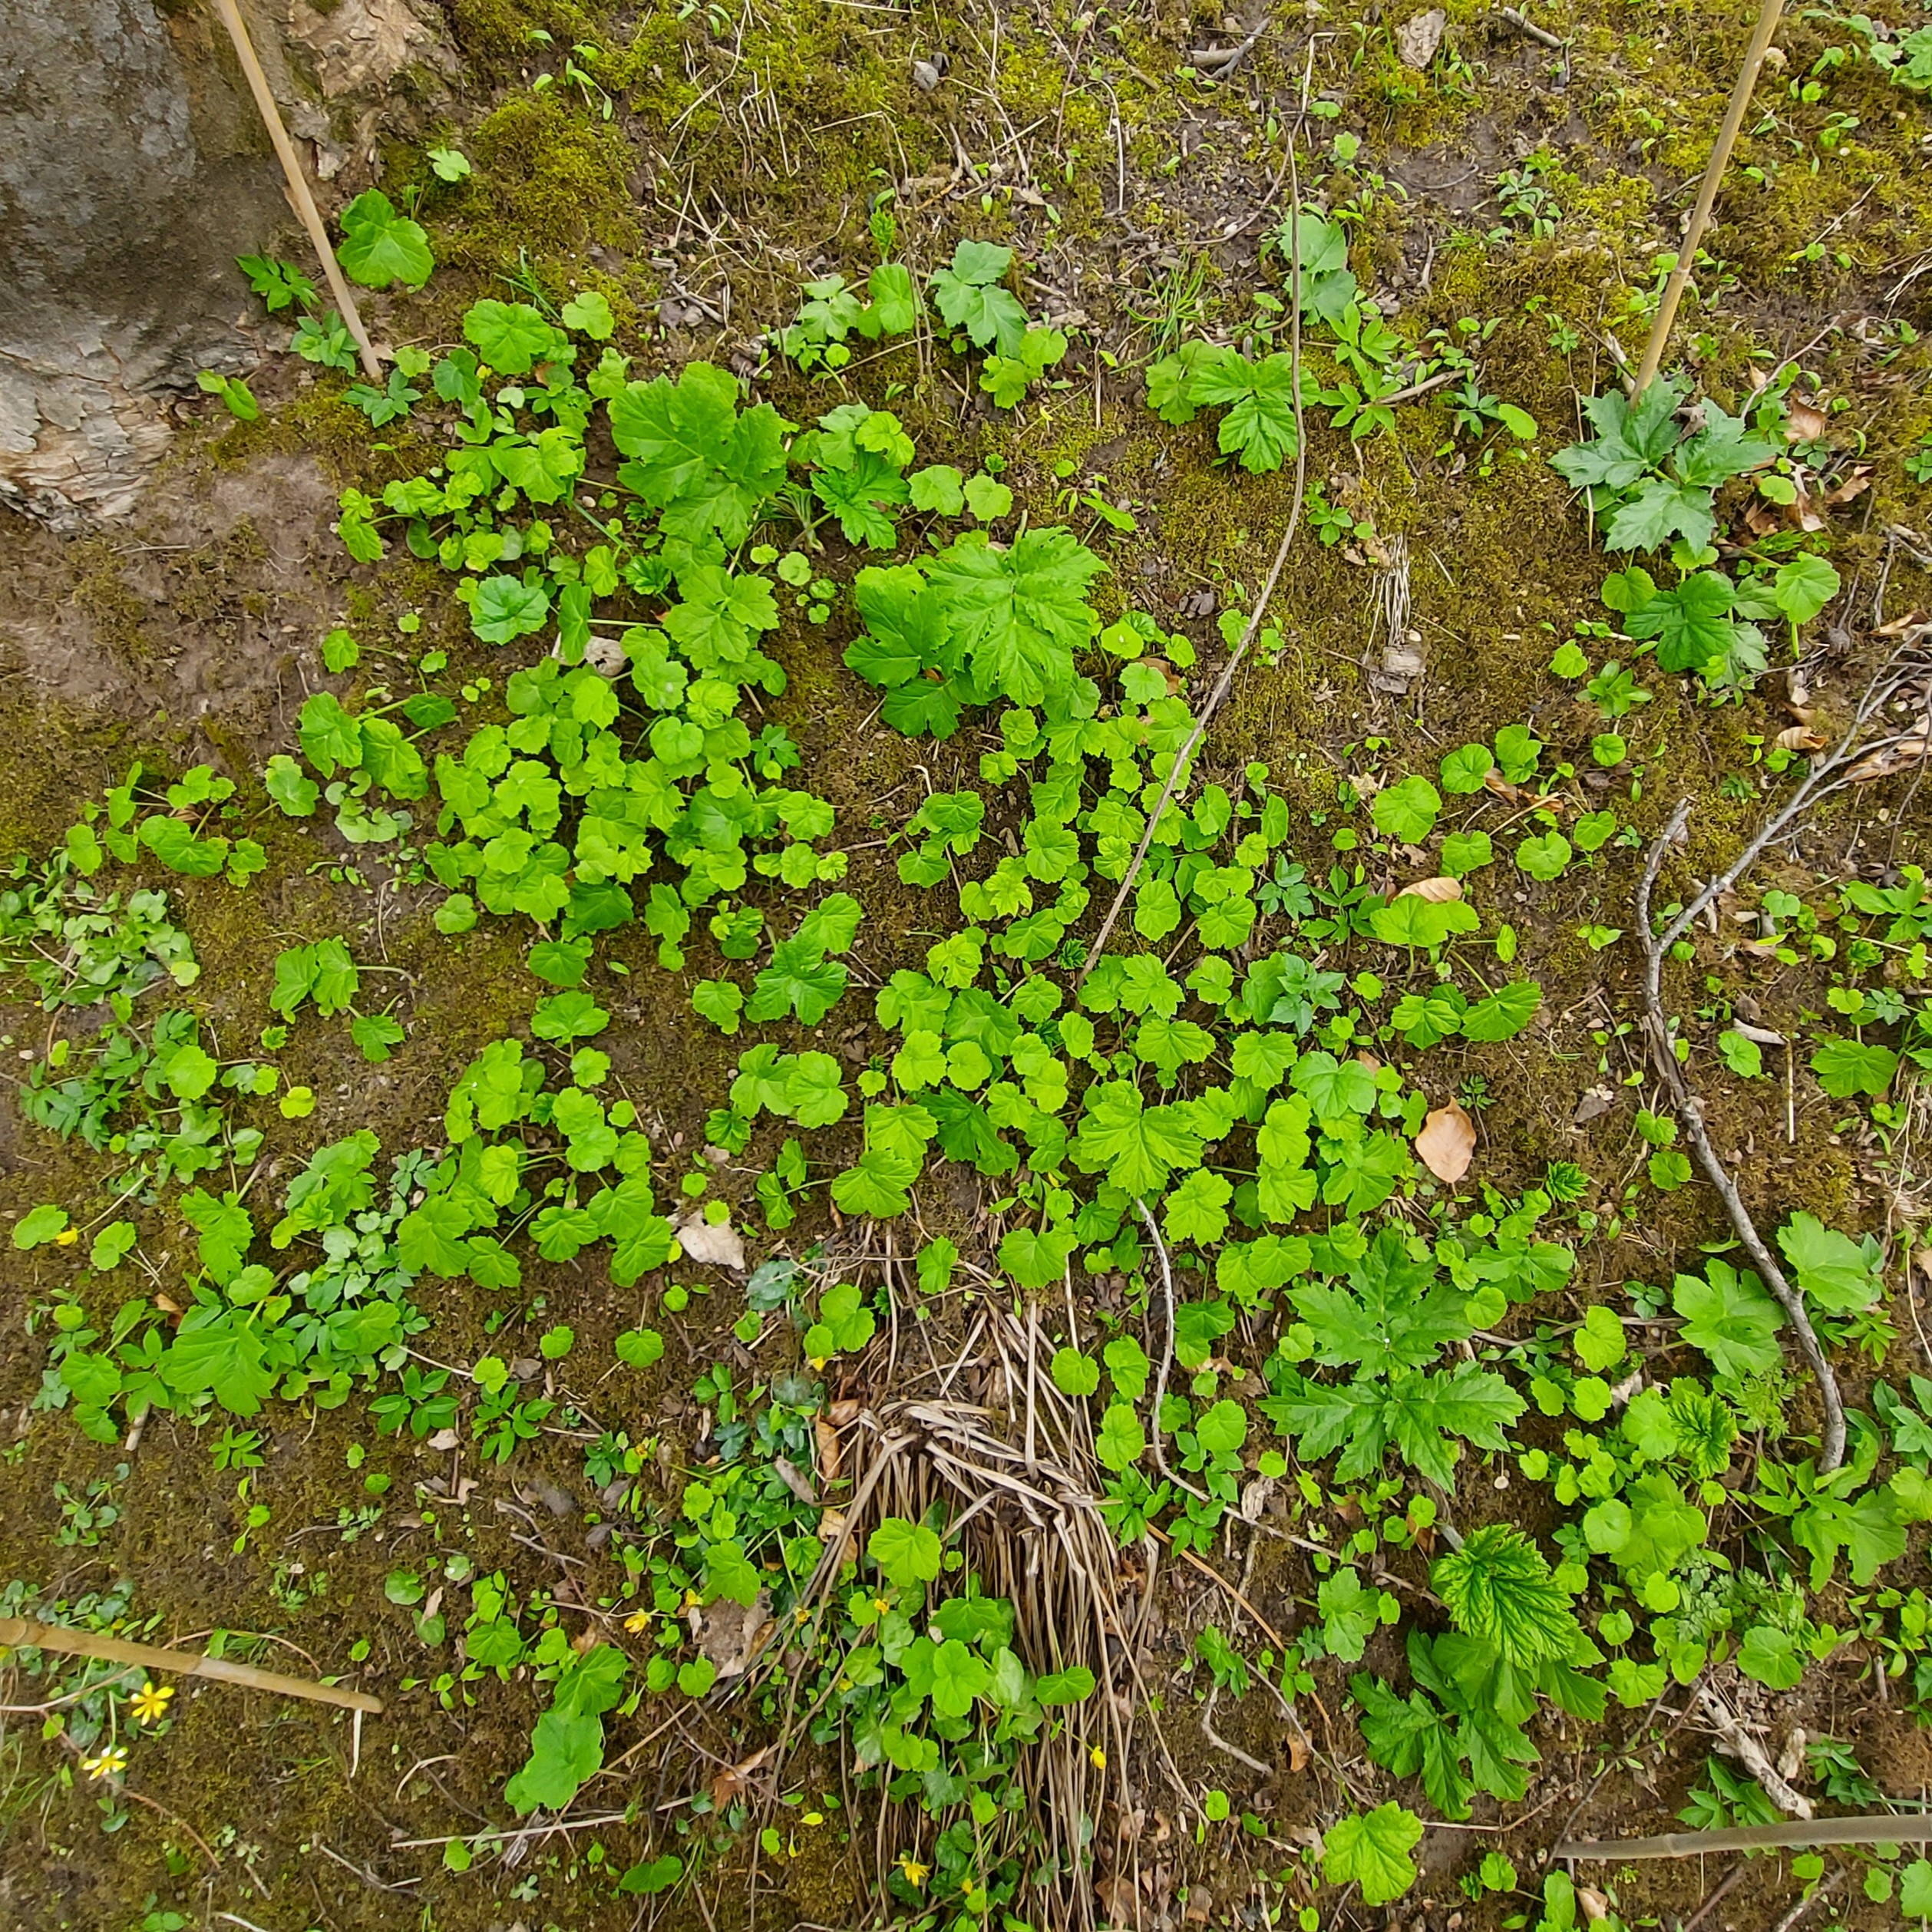
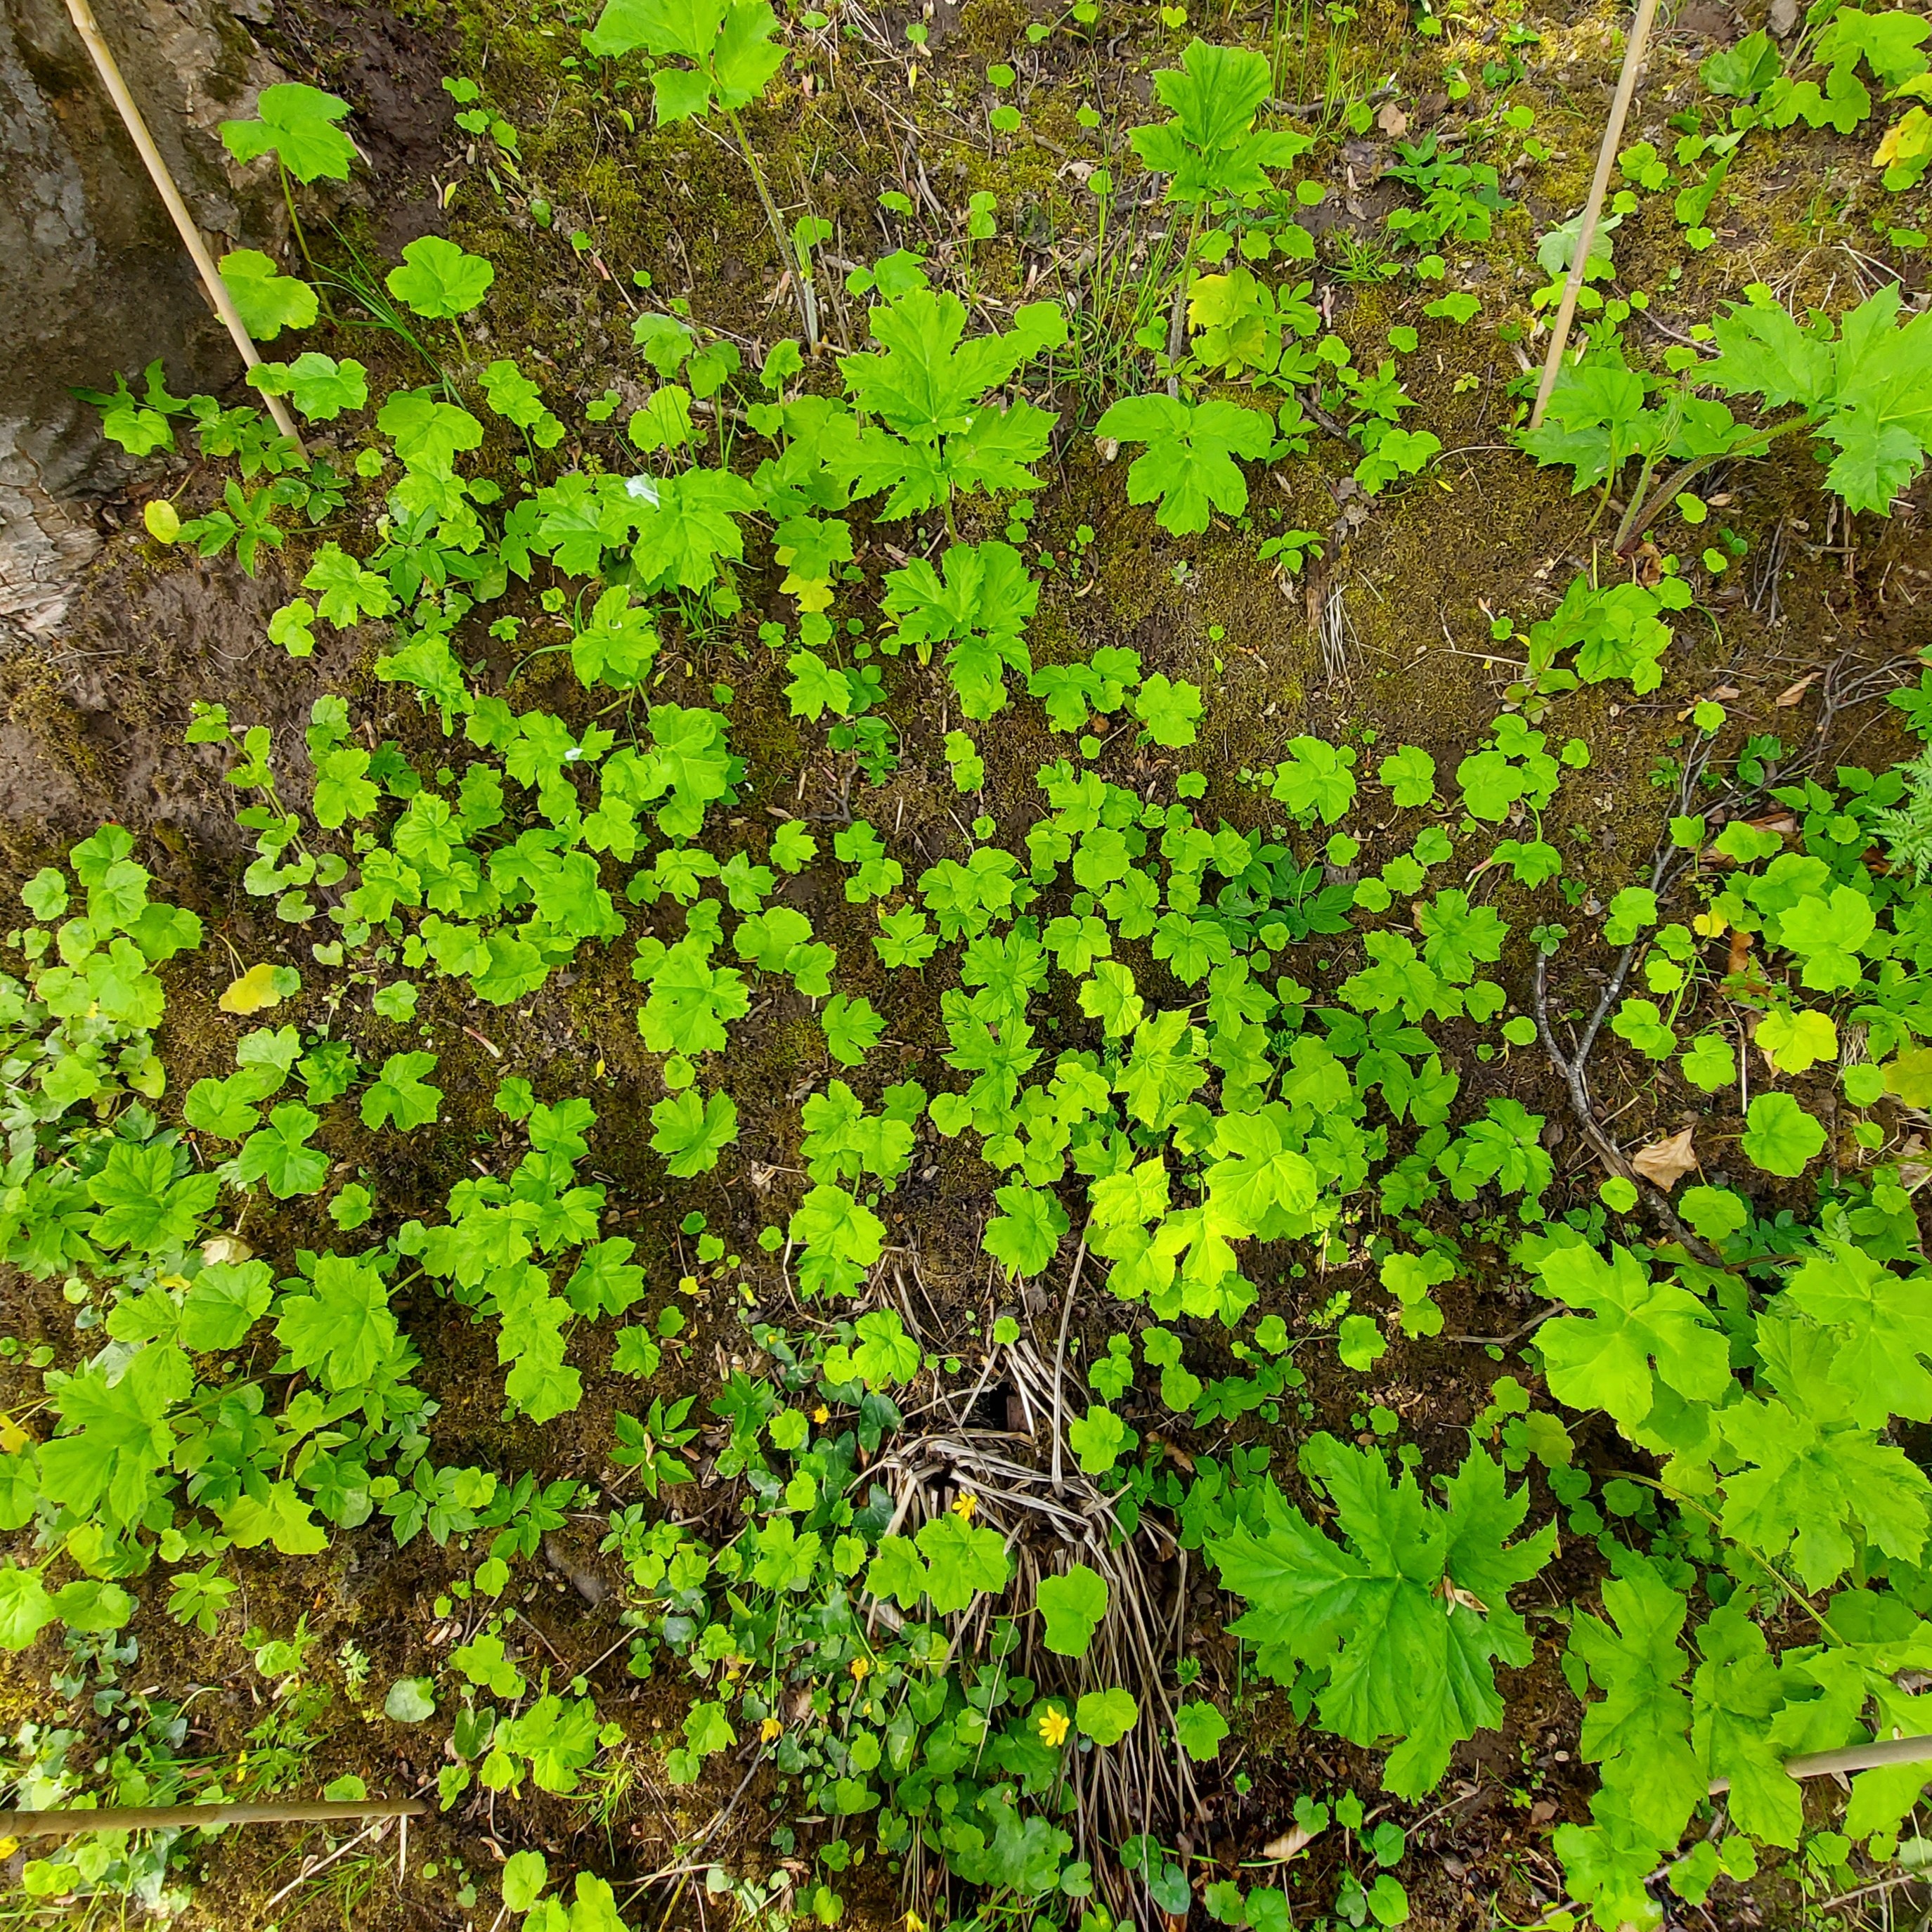
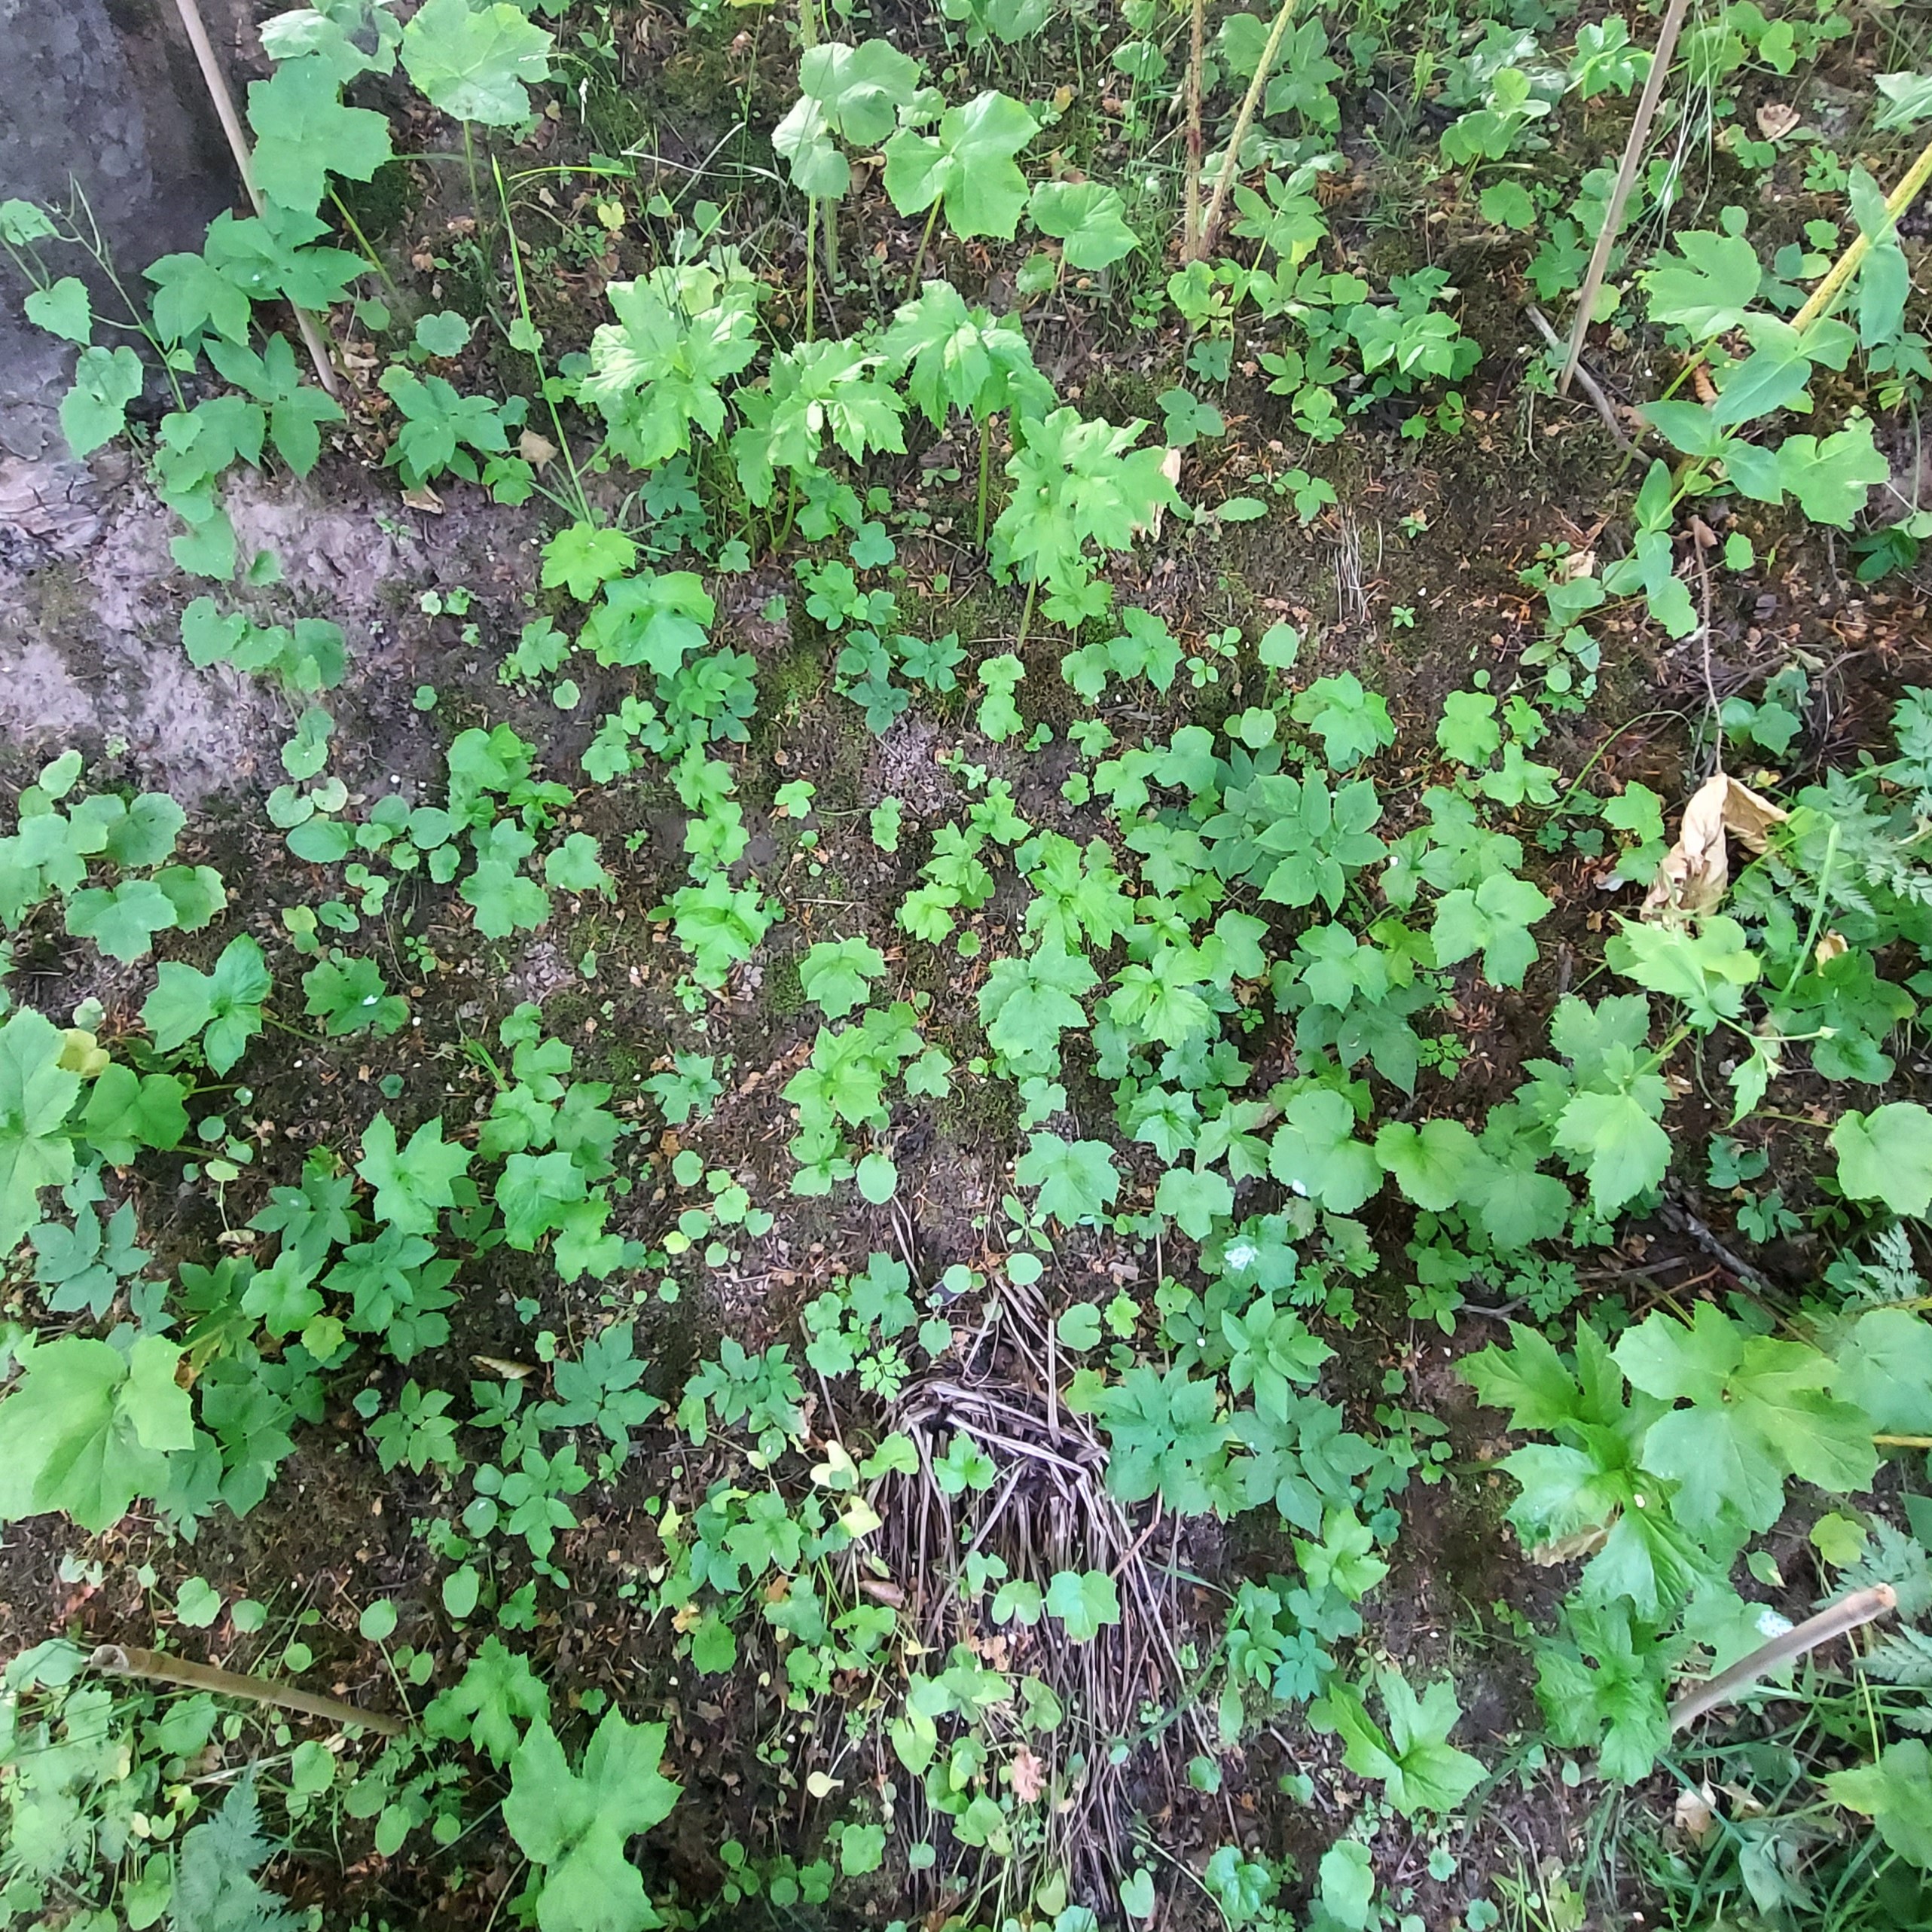
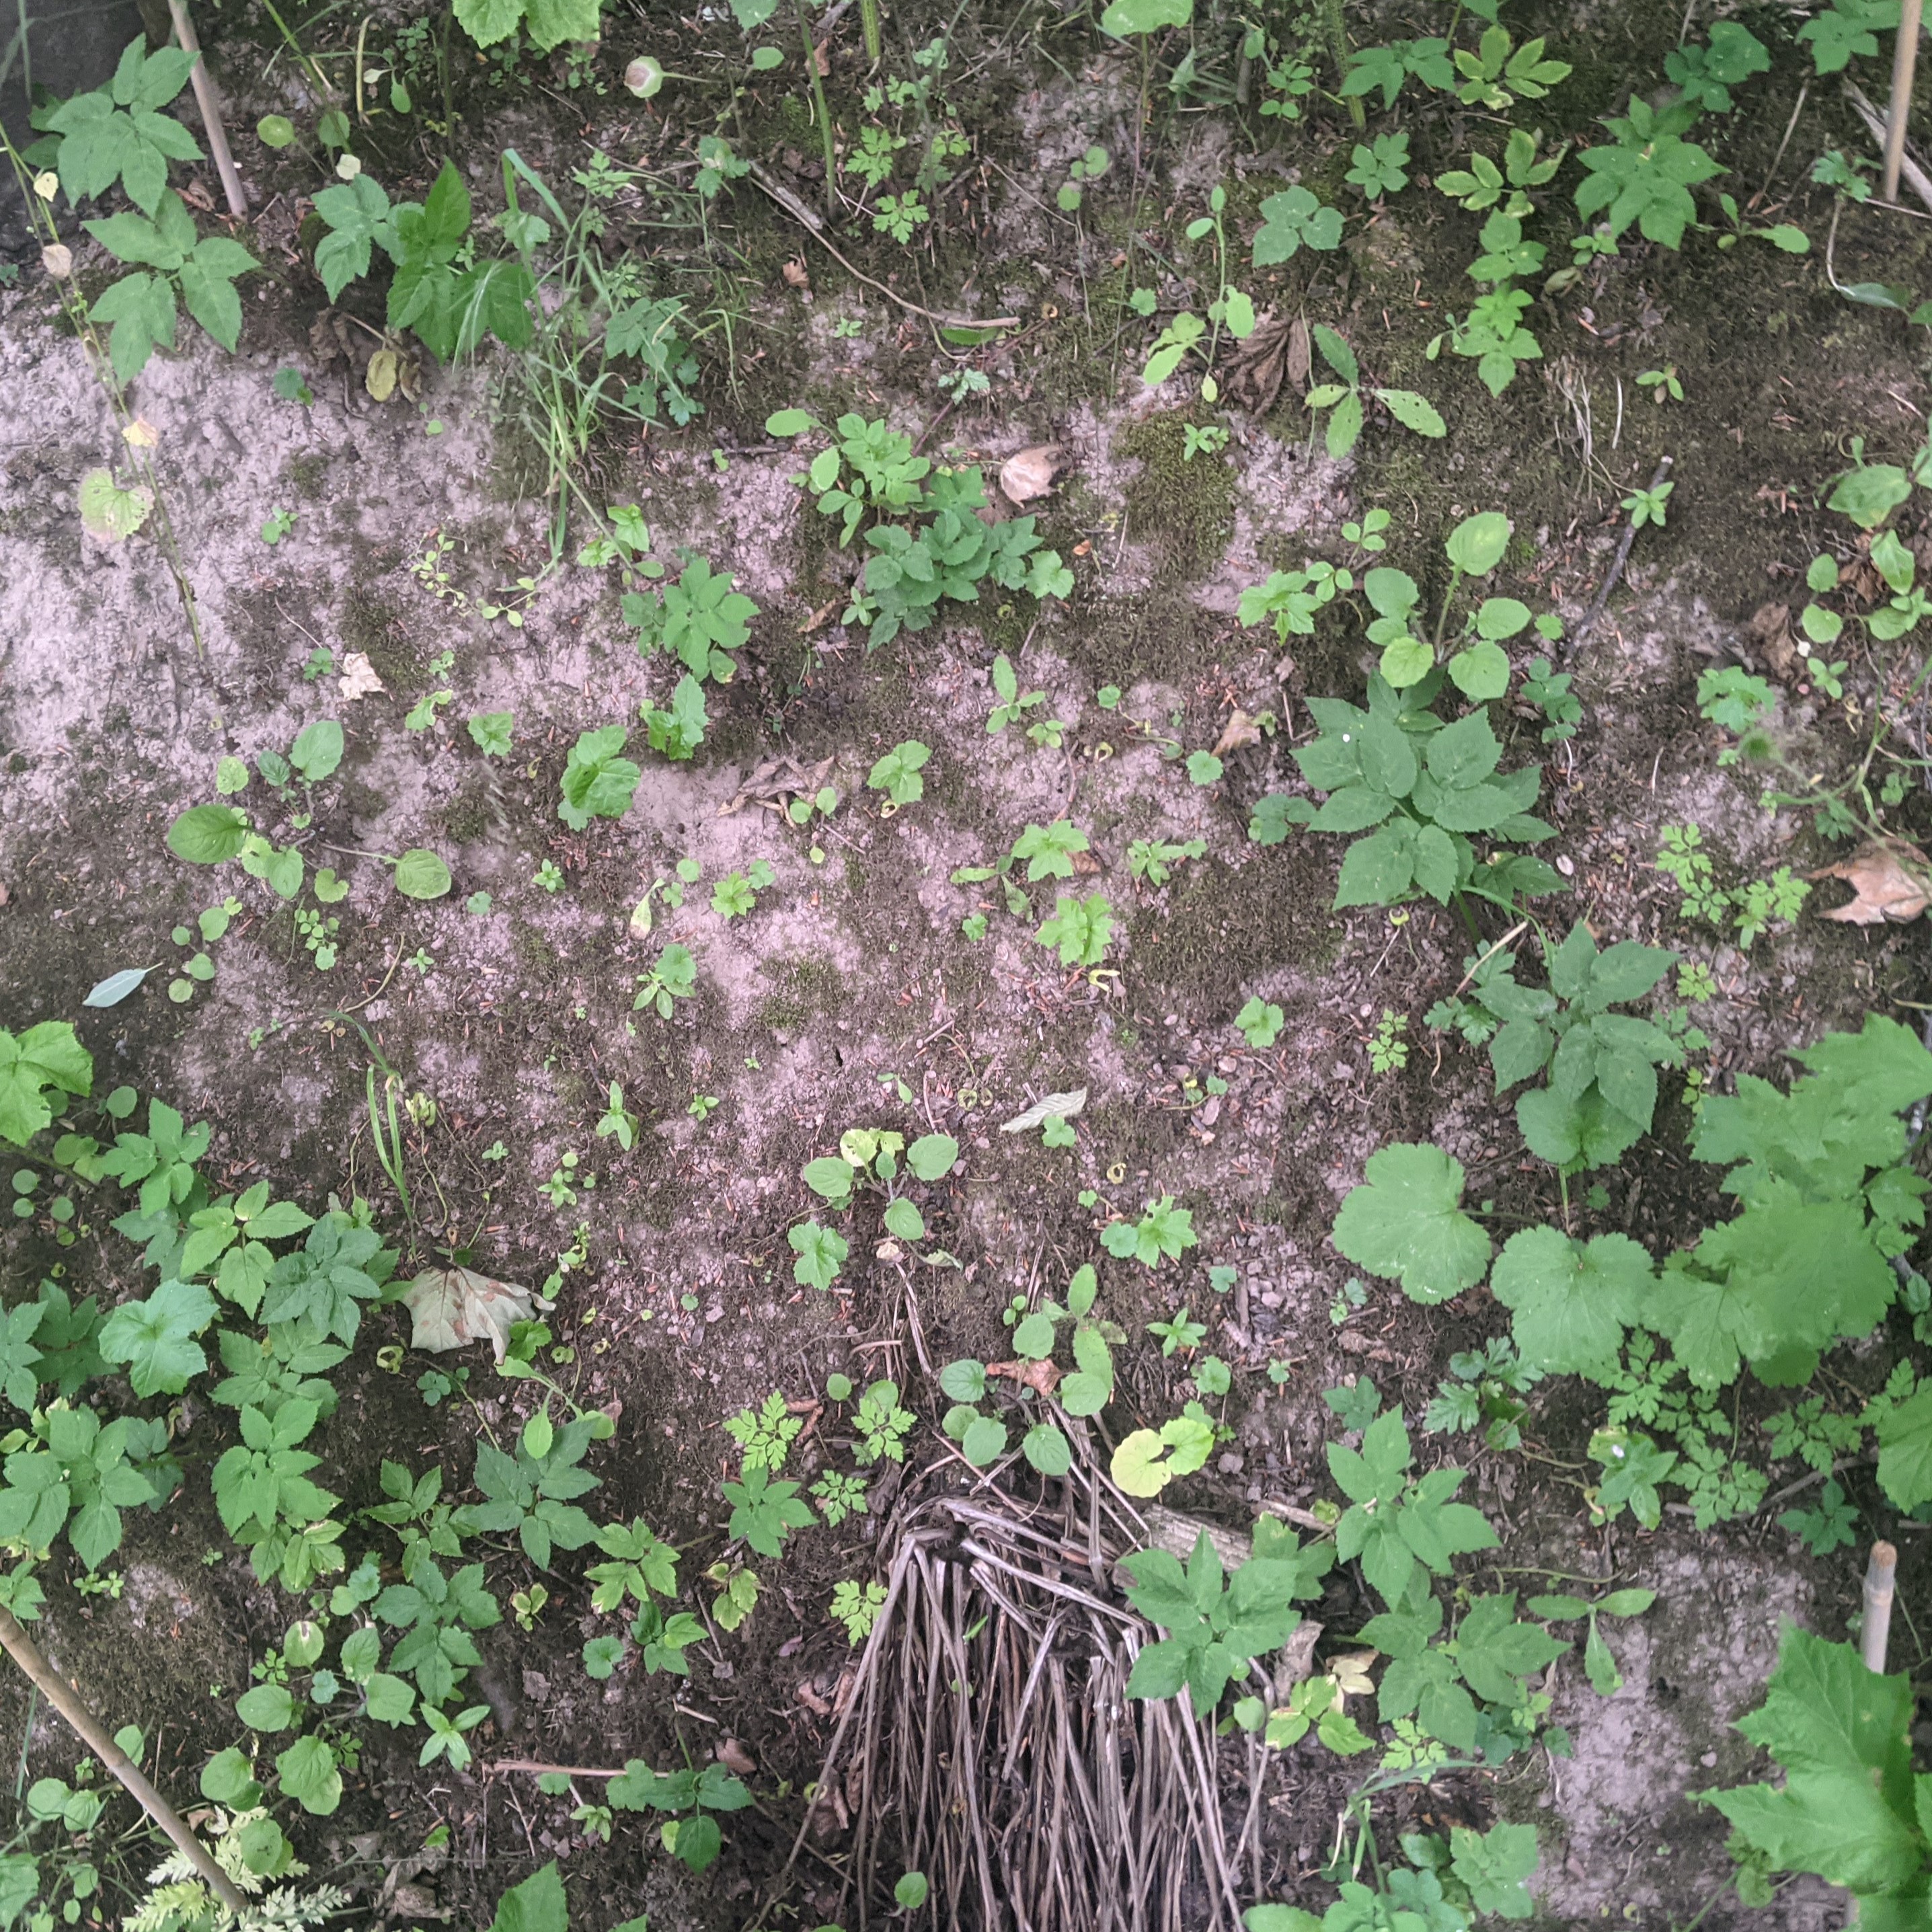
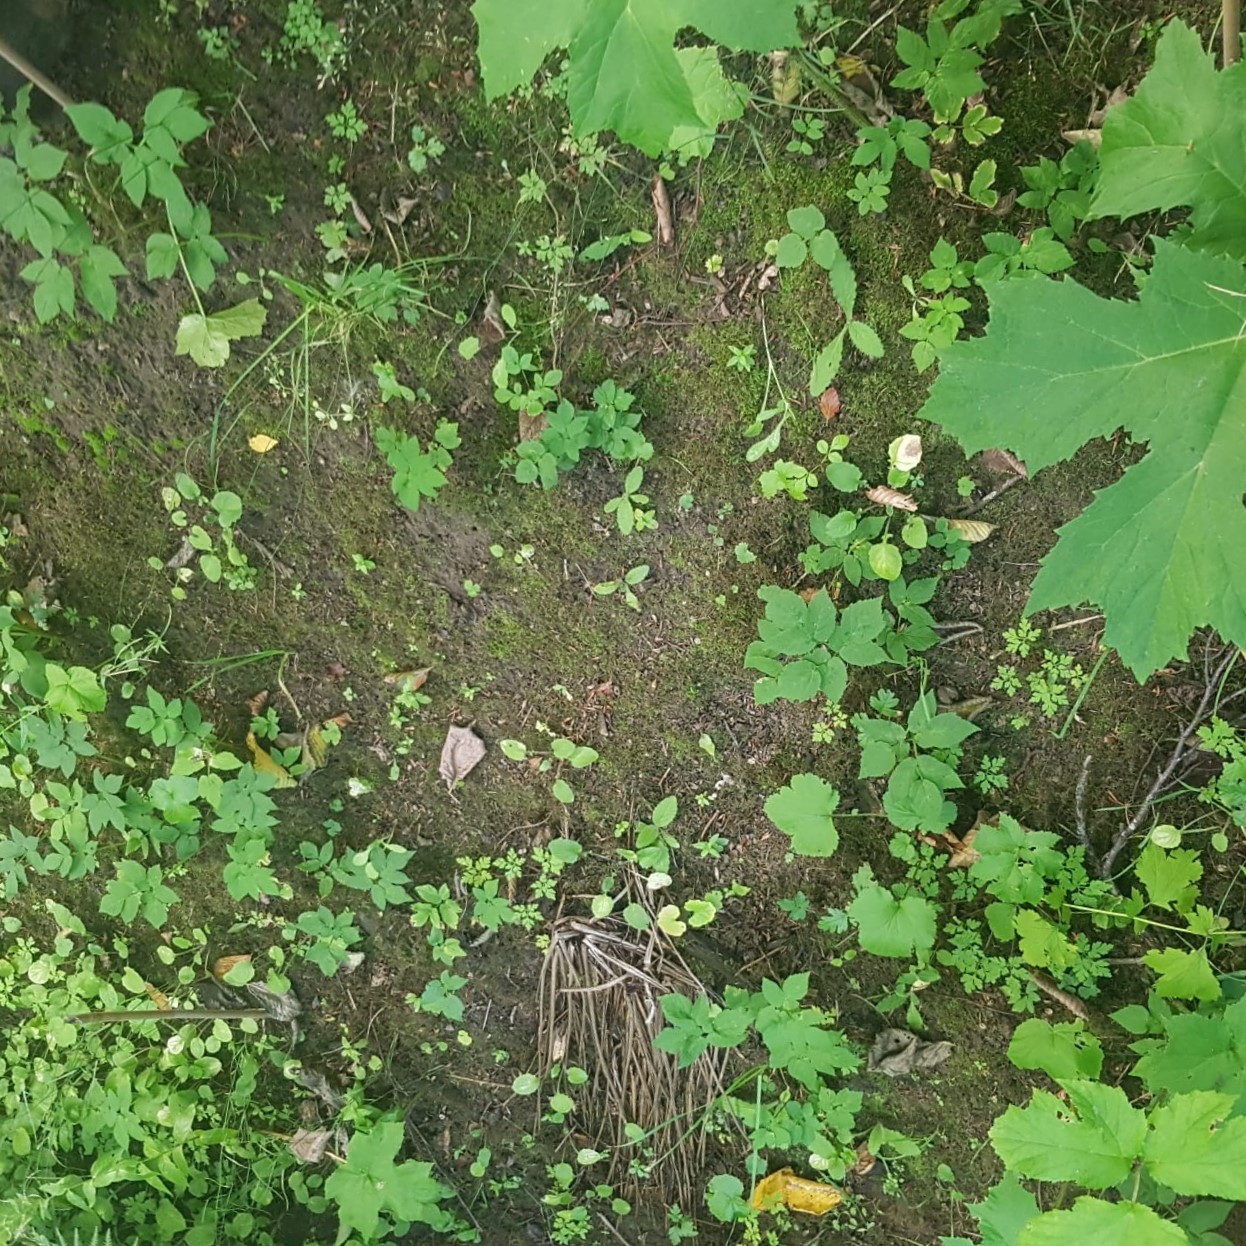
Images from each sample plot were taken at each monthly visit. An example of these is shown in Figure 7 - this provides visual confirmation of the increase in hogweed seedling emergence between site visits in March and May. An example set of monthly images across the study period (March to October) for a plot on the River Lossie in Moray is shown in Appendix 2 to show the observed changes in seedling abundance in this time.
 |
|
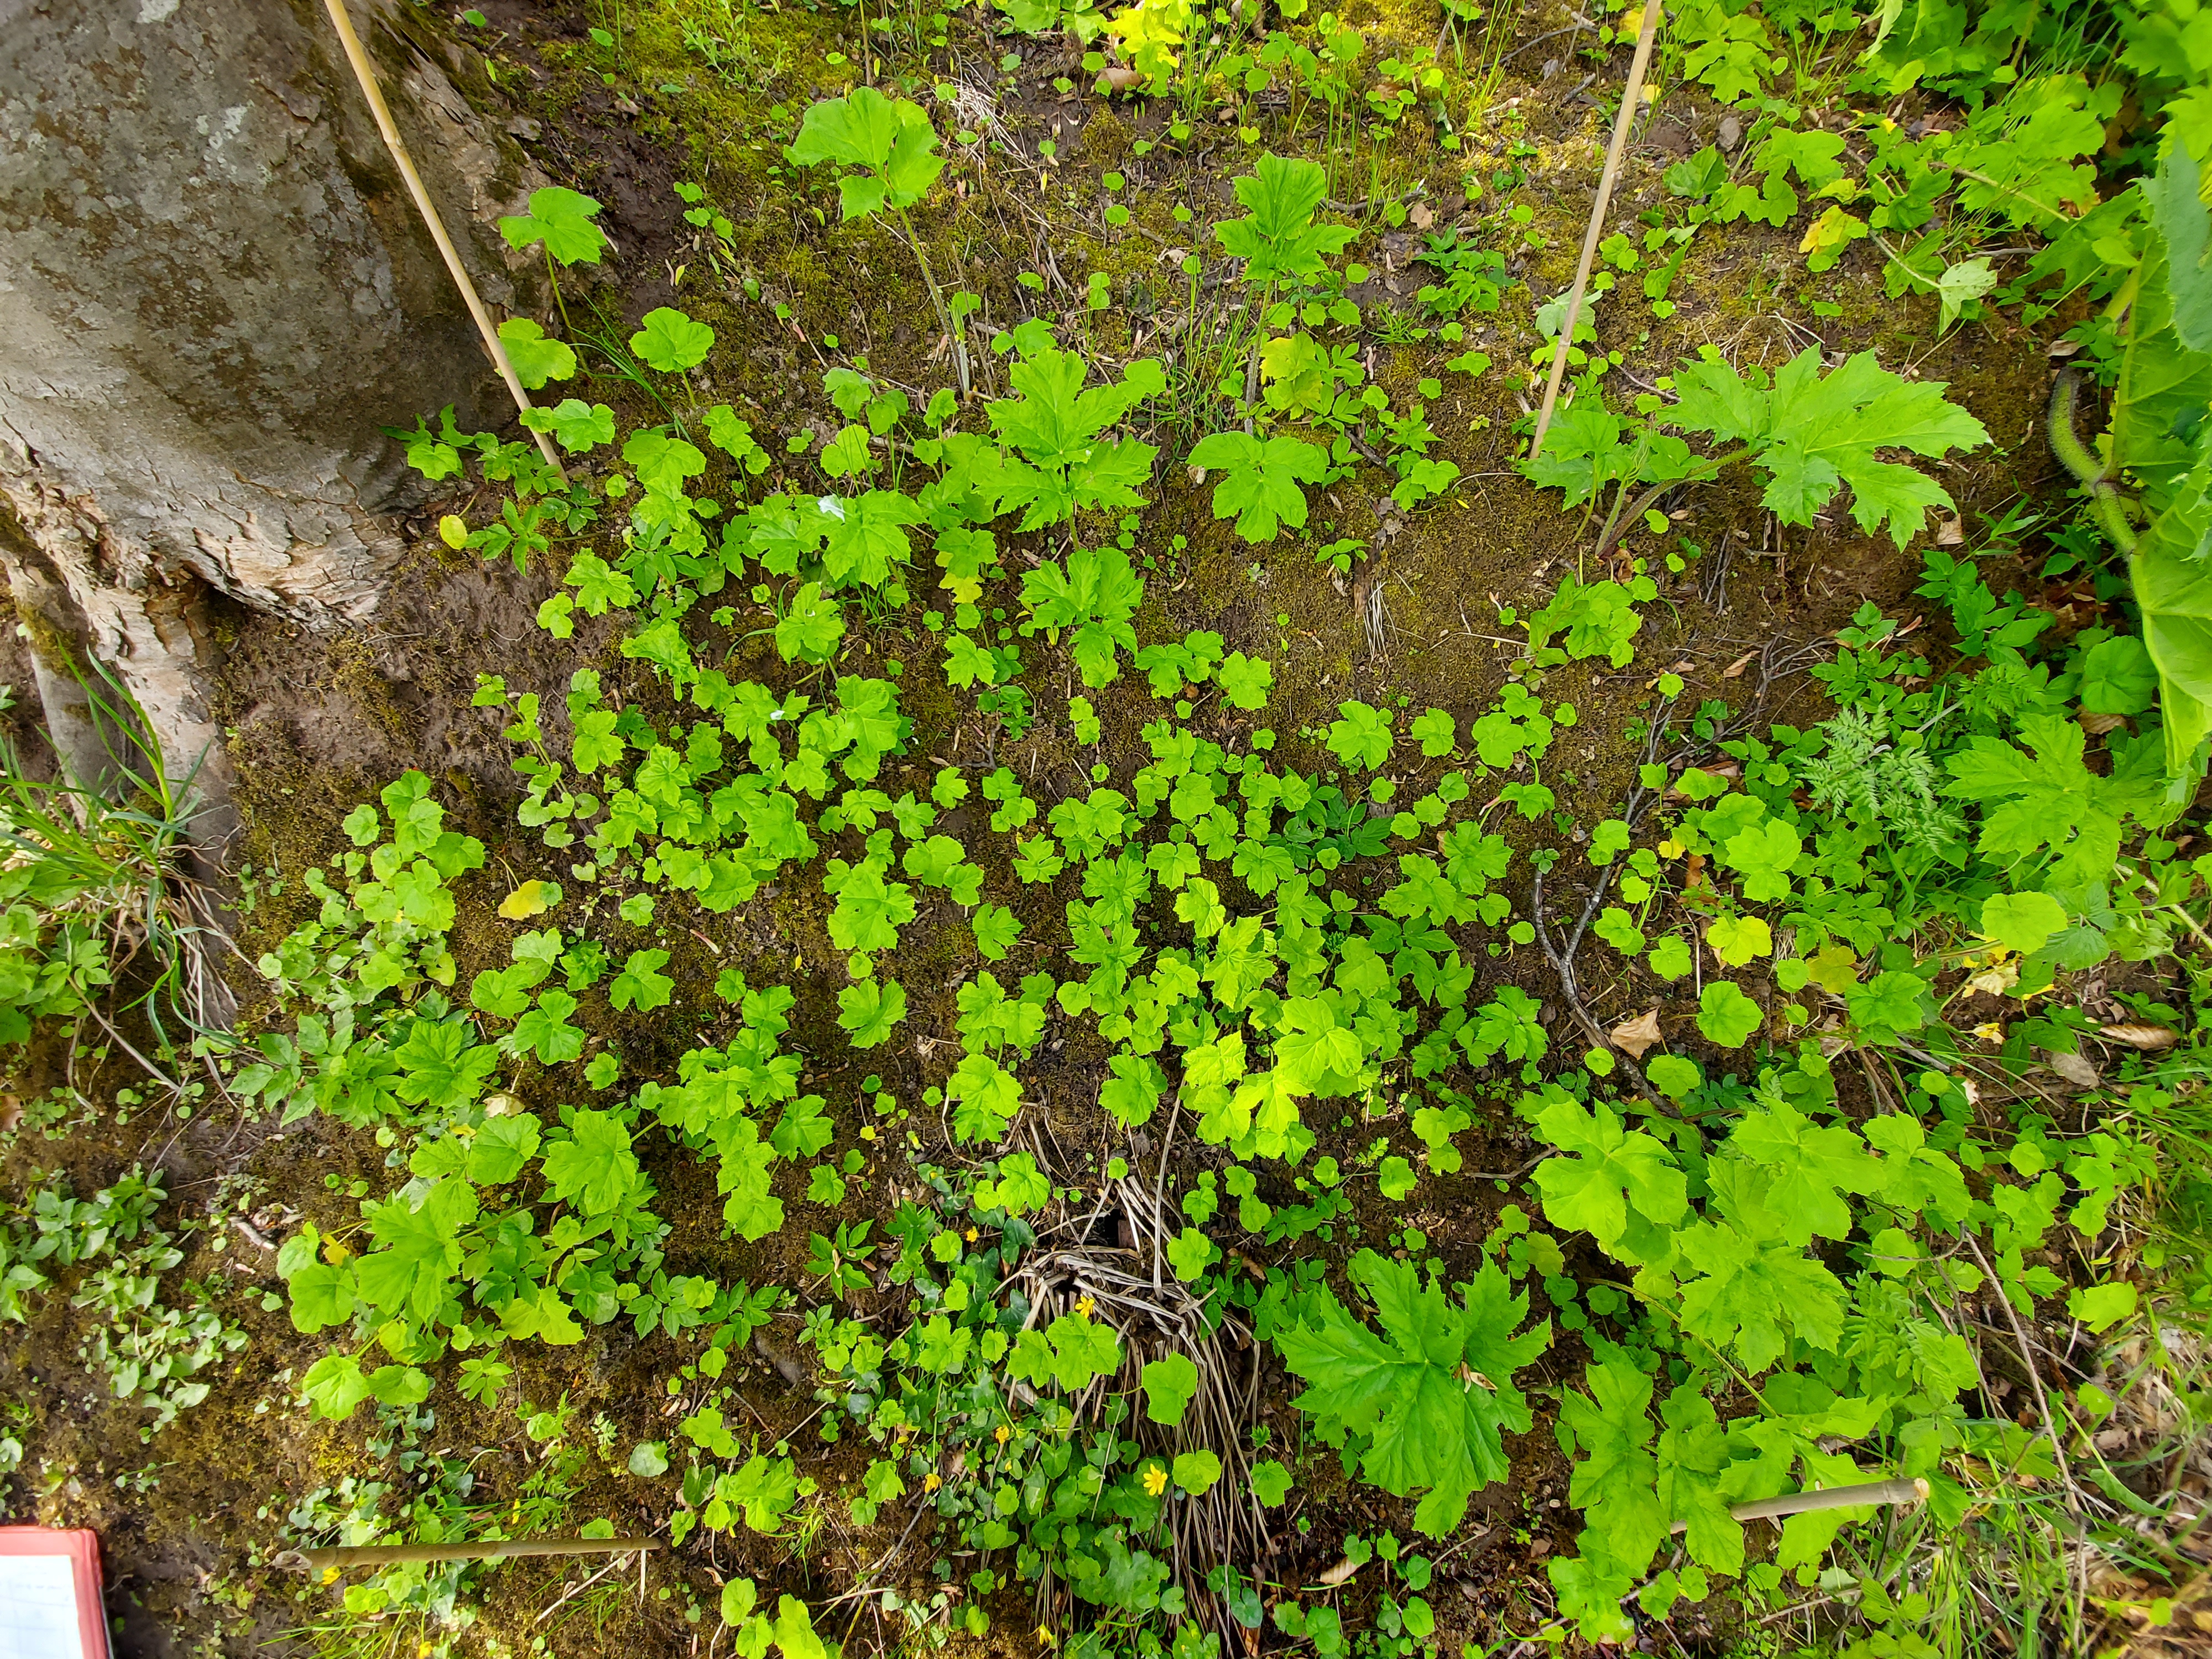 |
Figure 7: Typical seedling emergence pattern in a 1m2 plot in spring. Images taken in March (left) and May (right) from a plot in the River Lossie catchment in Moray.
5. Discussion
The seedling emergence curve shown in Figures 5 and 6 shows a clear seasonal pattern of emergence. Significant numbers of giant hogweed seedlings emerge in early spring (March) and probably in advance of this in February and, perhaps, January. From March emergence levels increase in April to a peak in May. After May emergence declines steadily in June and is low from July onwards. Seedlings continue to emerge until October but by this time of year total seedling emergence is minimal.
It is generally advised that the best time of year to treat hogweed by herbicide application is May and June. In July and early August, any remaining flowering heads should be removed before they go to seed to prevent further seed dispersal and potential establishment to new locations. Findings from this study support this typical control timeline as the study found peak seedling emergence to be in April and May.
The study found a significant number of giant hogweed seedlings had already emerged across the study site by the first week of March. It is likely that many of these emerged in February (and in some instances perhaps even in January). However, this does not conflict with the normal chemical treatment window in May and June. Early emerging seedlings would not flower before this typical treatment window and delaying treatment until this time ensures that the majority of seedlings likely to emerge in the growing season have done so and are large enough to be visible and identifiable for treatment. Similarly, seedlings emerging after this treatment window would not flower or seed within the same season and so would not be able to replenish the existing seedbank or disperse further to new locations.
This study found that giant hogweed emergence peaks in April and May. Whilst we recognise that this study has been undertaken for one growing season only, and was not replicated across all of Scotland, it was able to include various site conditions (river catchment, altitude, habitat type, tree canopy cover) and so we are confident our results are applicable in varied circumstances and at least for the majority of conditions and locations across Scotland. Therefore, there is some confidence that this finding is sufficiently robust to confirm the most appropriate period for chemical application (or grazing pressure) to emerging seedlings in each growing season.
Whilst this study could be replicated and expanded to further investigate seasonal seedling emergence, we are confident that the work to date is sufficient to inform practical management application.
6. Sheep Grazing Trial
Related to this study, the Scottish Invasive Species Initiative is undertaking a trial to deploy sheep grazing to control giant hogweed. Information on this work is available here. We will use the findings of the giant hogweed seedling emergence study to inform the guidance we are preparing on the use of sheep grazing as a method of giant hogweed control.
In order to deliver effective control through sheep grazing, it is important to know the optimal time of year for grazing to begin and end. In our grazing trial, we are likely to advise that sheep are released onto a site at the beginning of May and removed at the end of August. The seedling emergence study reported here supports this advice.
Releasing sheep to a site at the beginning of May will ensure that:
- Grazing occurs throughout the period of peak seedling emergence, and
- Seedlings which have emerged (from growth from late February to April) will be grazed.
Furthermore, continuing grazing until the end of August will ensure that seedlings emerging over the May to August period can be grazed effectively. Any plants remaining after grazing has been stopped will not be able to flower and seed, remain relatively small and be available to graze in the following season.
Although not related to seedling emergence our grazing period advice also helps to both reduce the risk of overgrazing of native flora at each site and of poaching of the ground - the latter more likely if winter grazing is undertaken.
Acknowledgements
We would like to thank the volunteers and project partner staff who participated in this study. The Scottish Invasive Species Initiative is a volunteer-based project and, as always, this work would not have been possible without the help of our partners and volunteers.
This study, to accompany our work assessing giant hogweed grazing by sheep as a control method, was formulated with essential input from Professor Rene van der Wal (then Professor of Ecology at the University of Aberdeen) and Annie Robinson (University of Aberdeen).
The data collection for this study was co-ordinated by Karen Muller, Project Officer for the Deveron, Bogie and Isla Rivers Charitable Trust, with the report produced by Karen Muller, Jane Hamilton (Volunteer and Communications Officer) and Callum Sinclair (Project Manager).
Appendix 1
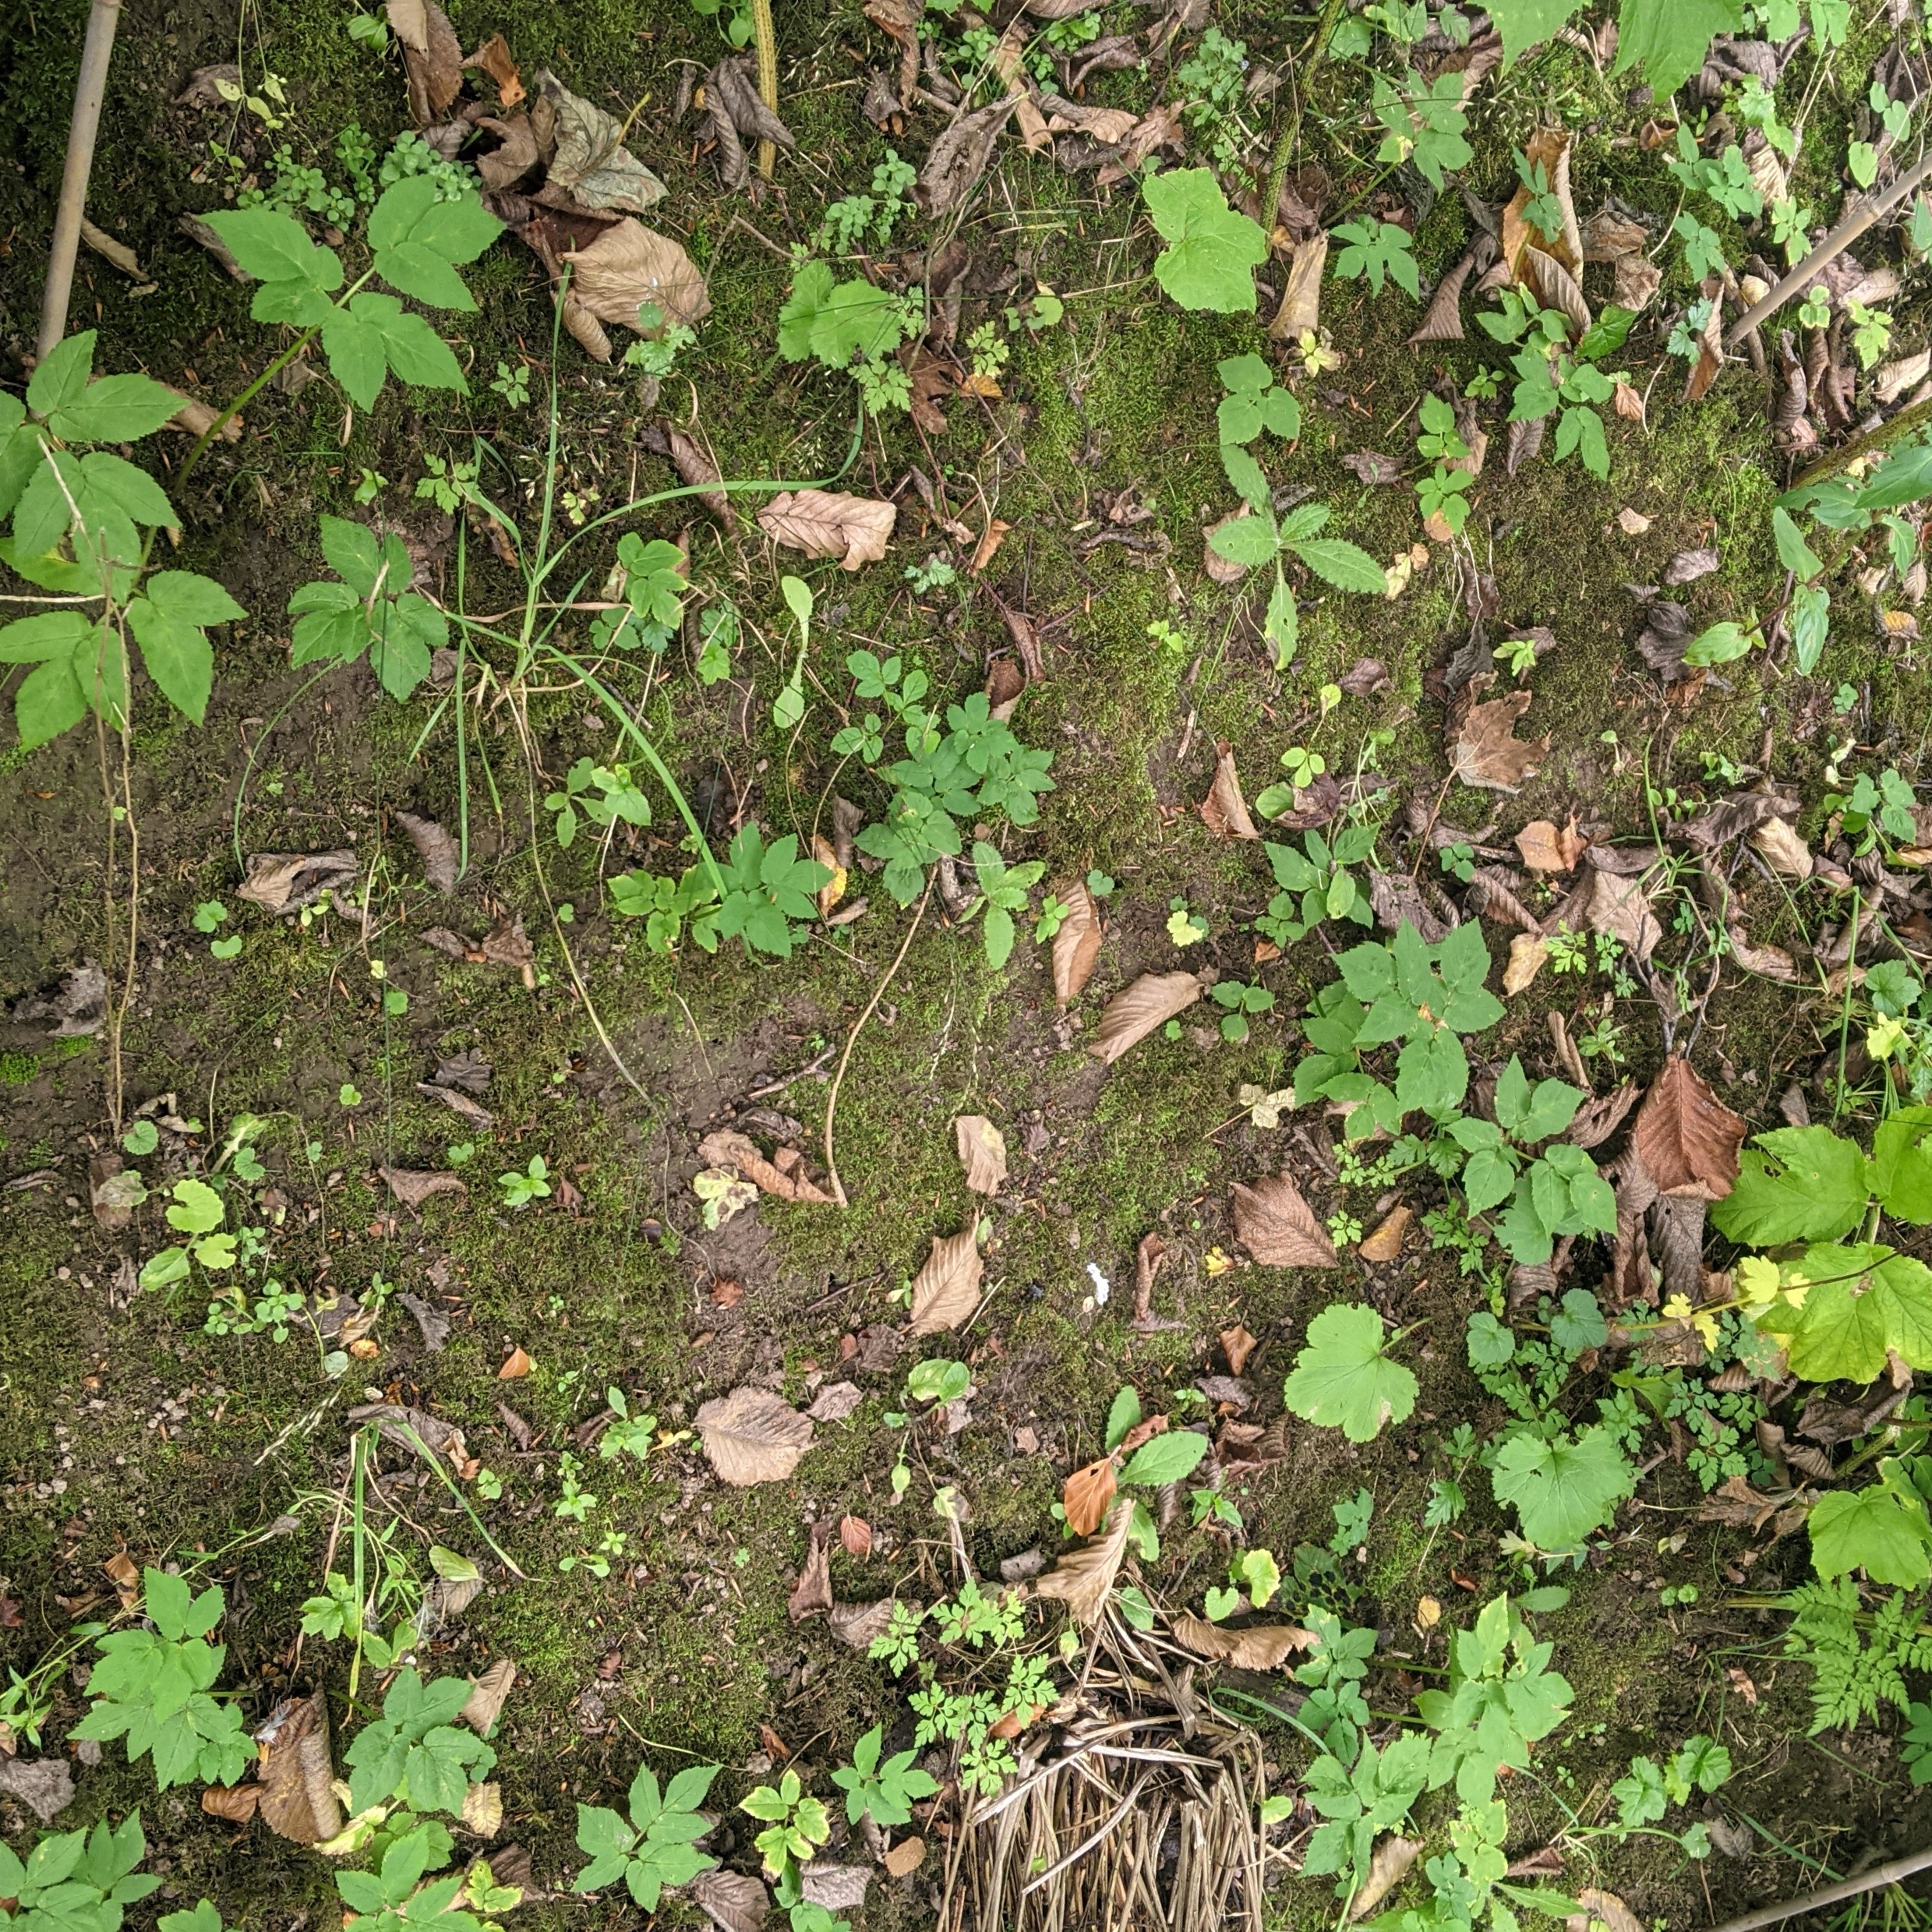
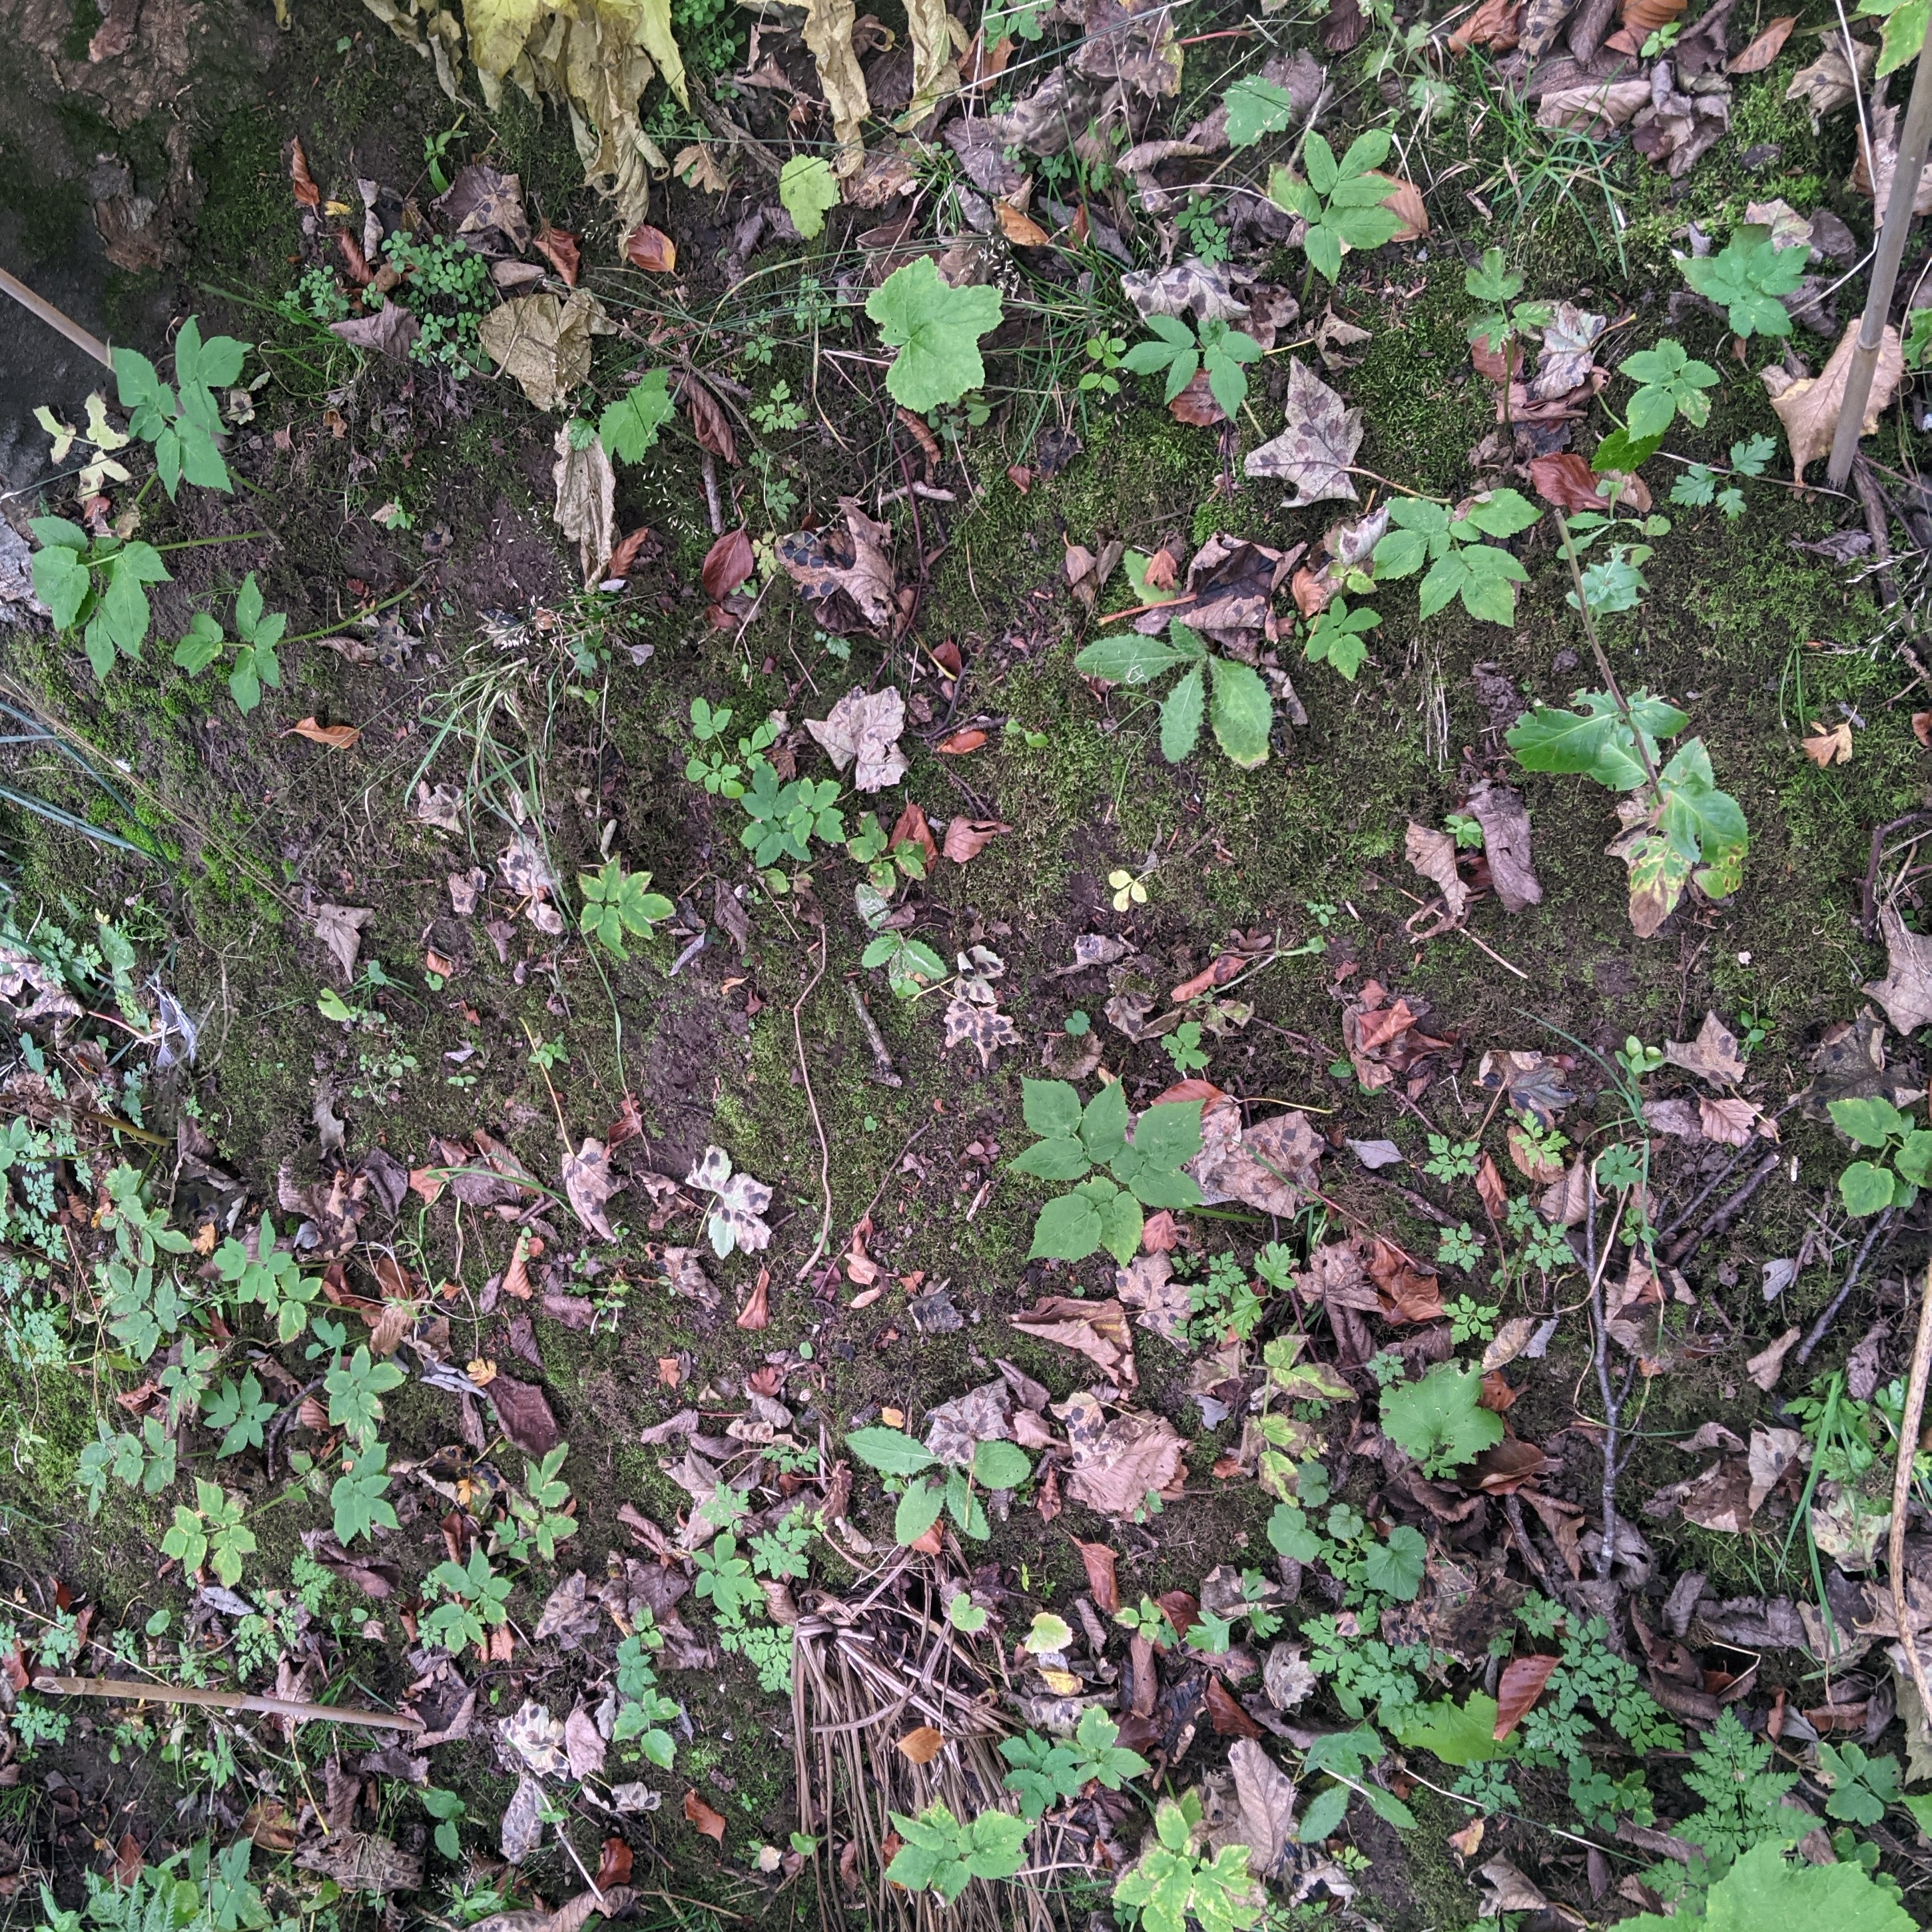
Typical seedling emergence pattern in a 1m2 plot throughout the duration of the study (March – October 2021). Images taken from a plot in the River Lossie catchment in Moray.
 |
 |
 |
||
| March | |
April | May | |
 |
 |
 |
||
| June |
|
July | August | |
 |
 |
|||
| September |
|
October |